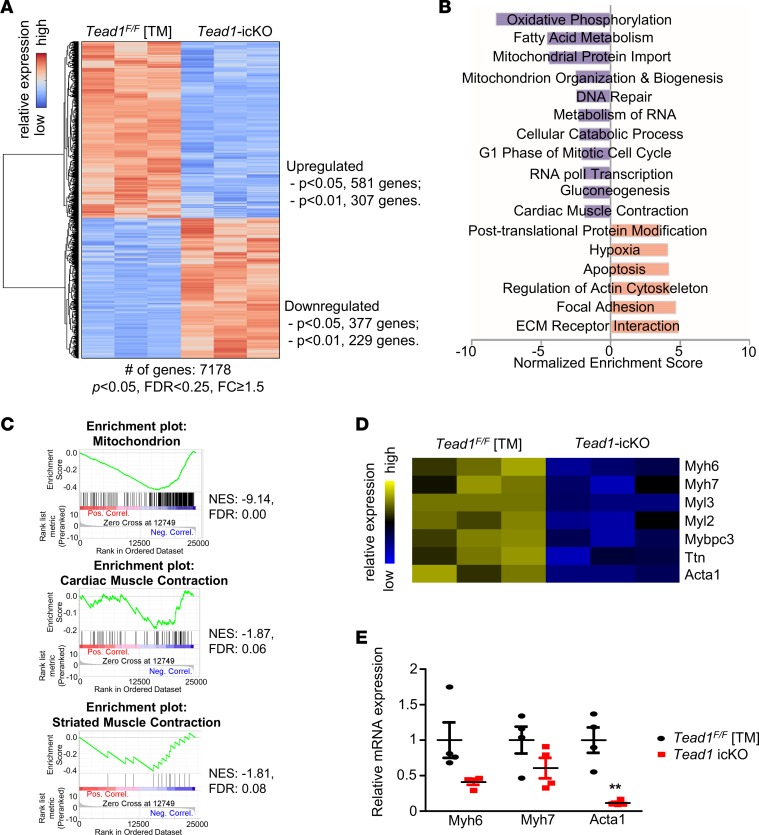
Figure 6. Global transcriptome analysis of Tead1-icKO heart.
(A) Gene clustering by Z-score using Euclidean distance metric in control (Tead1F/F TM) and icKO samples. Gene expression fold change (FC) was calculated by icKO over control. P < 0.05, FDR < 0.25, FC ≥ 1.5. (B) Selected Gene Set Enrichment Analysis (GSEA) pathways in Tead1-icKO. (C) Enrichment plots showing the selected enriched pathways in Tead1-icKO dataset. (D) Heatmap of genes encoding key structural proteins of sarcomere. (E) qPCR confirmation of mRNA expression of selected genes encoding sarcomere-related proteins differentially changed on microarray (n = 4).

