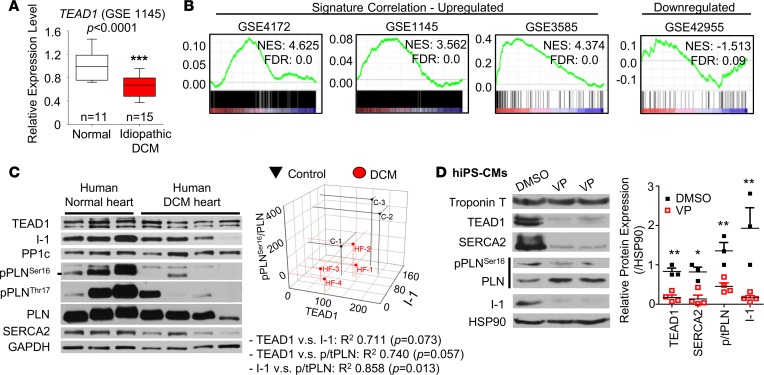
Figure 7. TEAD1 is required for normal SERCA2a, Inhibitor-1, and phospholamban (PLN) phosphorylation in human cardiomyocytes.
(A) Box-whisker plots showing the expression of TEAD1 in human heart samples from idiopathic DCM patients (GSE 1145), presented as mean ± SEM, analyzed by Student’s t test. ***P < 0.001. (B) Enrichment plots showing a strong association between Tead1-icKO gene dataset and the enrichment of published human DCM GSE dataset signature genes. NES, normalized enrichment score. (C) Immunoblot of human heart ventricle samples from normal control individuals and patients with DCM. Associated 3-D scatter plot of the correlation among protein expression of TEAD1, I-1, and pPLNSer16/PLN ratio. Pearson’s correlation was used to determine P values, shown in adjoining table. (D) Representative immunoblot from human induced pluripotent stem cell–derived cardiomyocytes (hIPSC-CMs) treated with verteporfin (VP) 2 μg/ml overnight. The quantification of the protein expression fold changes is plotted from 3 independent experiments. p/tPLN, ratio of phospho to total PLN.

