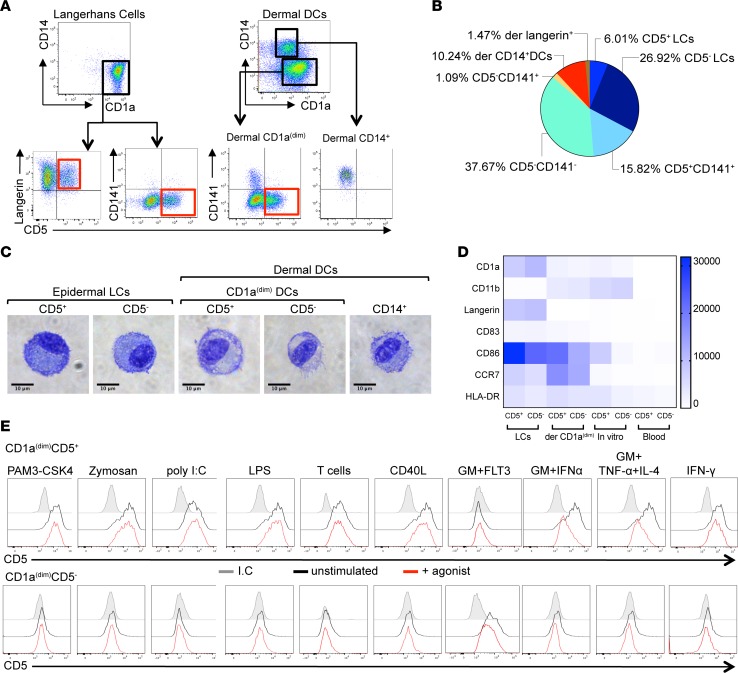
Figure 1. Identification of Langerhans cells and dermal DC subsets in human skin.
(A) Top: Expression of CD1a and CD14 on purified skin DCs defines epidermal CD1a+ LCs, dermal CD1adim DCs, and dermal CD14+ DCs subpopulations. Bottom: Expression of CD5 defines subpopulations of CD1ahiLangerin+ LCs and dermal CD1adimCD141– DCs. (B) Relative representation of each human DC subset in normal skin (n = 33). The percentage of individual DC subsets mean ± SD ± SEM of the total migrating DCs (HLA-DR+CD3/19/56–) cells is plotted. Epidermal CD5+ LCs: 6.0% ± 6.15% ± 1.05%; CD5– LCs: 26.9% ± 20.4% ± 3.4%; dermal CD1adim DCs, CD5+: 15.8% ± 12.6% ± 2.16%; CD5–: 37.6% ± 18.9% ± 3.2%; CD141+: 1.09% ± 2% ± 0.3%; dermal CD14+ DCs: 10.2% ± 7.6% ± 1.3%. (C) Morphology of sorted skin CD5+ LCs, CD5– LCs, dermal CD1adimCD5+ DCs, CD1adimCD5– DCs, CD1adimCD141+ DCs, and CD14+ DCs visualized by GIEMSA staining. Scale bar: 10 μM. (D) HLA-DR+CD11c+CD14–CD1c+CD5+ and CD5– DCs from skin epidermis, dermis, blood, and in vitro–differentiated cultures were analyzed for the expression of CD1a, CD11b, Langerin, CD83, CD86, CCR7, and HLA-DR. The plot shows GeoMean intensity, with values of the background staining subtracted. The mean values obtained for 2–4 donors are plotted. (E) Dermal CD1adimCD5+ and CD5– DCs were sorted and stimulated as indicated. Histograms show expression of CD5 on the cells after 6 days of stimulation (red histograms). One representative of 3 donors is shown.

