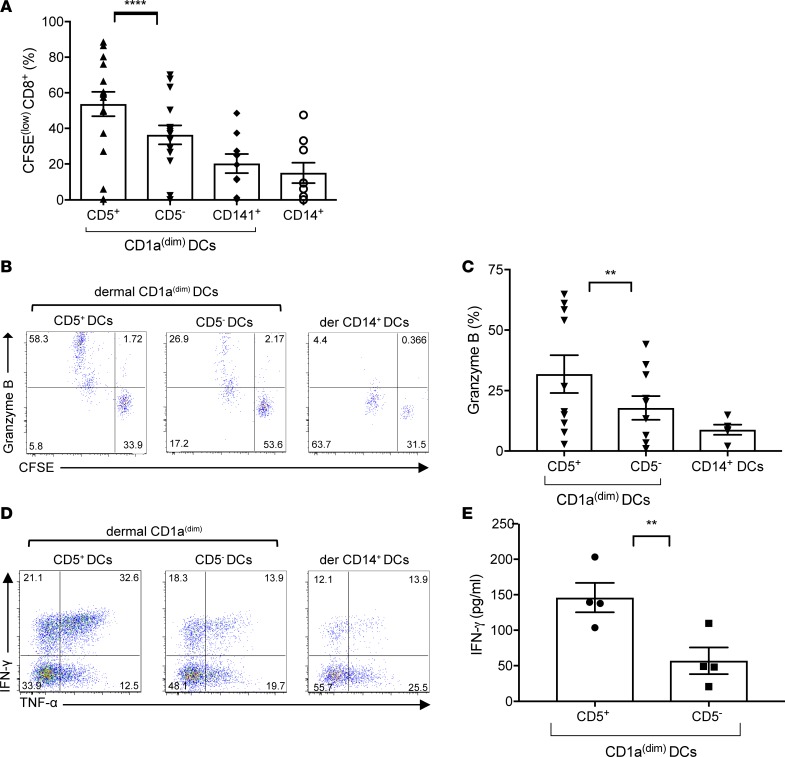
Figure 2. Dermal CD5+ DCs are more efficient than their CD5– counterparts at priming CTLs.
(A) Allogeneic naive CD8+ T cells primed with sorted CD40L-activated skin dermal CD5+ or CD5– CD1adim DCs, dermal CD1adimCD141+ DCs, or dermal CD14+ DCs at ratio 1:40 for 7 days. The graph shows the percentage of proliferating (CFSElo) CD3+CD8+ T cells (n = 15). Mean ± SD ± SEM for CD5+: 53.7% ± 26.6% ± 6.8%, CD5–: 36.4% ± 20.7% ± 5.3%, CD141+ DCs: 20.2% ± 16.1% ± 5.3%, CD14+ DCs: 15.1% ± 17% ± 5.6%. (B) Allogeneic CFSE-labeled naive CD8+ T cells primed for 7 days by each dermal skin mDC subset were stained and analyzed by flow cytometry for the expression of granzyme B. The percentage of cells that diluted CFSE and expressed granzyme B is shown. One of 8 experiments is shown. (C) The plot shows the percentage of cells primed by each of the mDC subsets and expressed granzyme B (n = 8). (D) The plots show the expression of IFN-γ and TNF-α by naive CD8+ T cells that were primed by either dermal CD5+ or CD5– DCs. CD8+ T cells primed by the dermal CD14+ DCs are shown as a control. One of 5 experiments is shown. (E) CFSEloCD8+ T cells that were primed by either dermal CD1adimCD5+ or CD5– DCs were reactivated by anti-CD3 and anti-CD28 mAbs for 18 hours. IFN-γ was measured in the culture supernatant by a Luminex magnetic bead assay. The graph shows the pooled results of 4 experiments. Data represent mean ± SEM; **P < 0.01, ****P < 0.0001 by paired Student’s t tests (A, C, and E).

