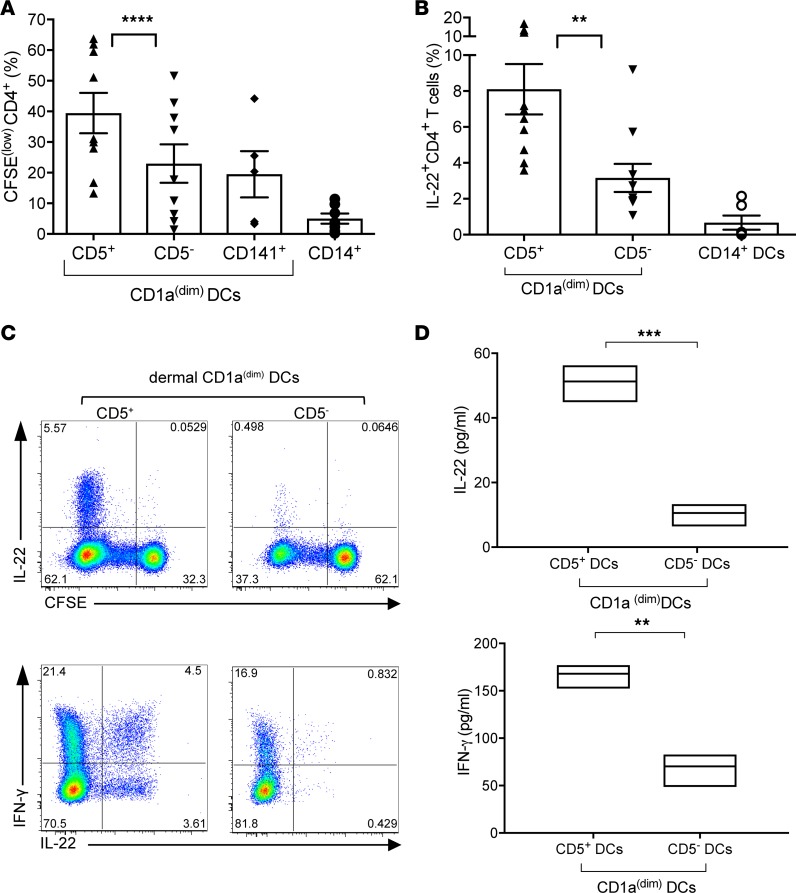
Figure 3. Dermal CD5+ DCs are superior to dermal CD5– DCs at inducing the proliferation and differentiation of Th22 cells.
(A) Proliferation of allogeneic naive CD4+ T cells primed with sorted CD40L-activated dermal CD5+ or CD5– CD1adim DCs, dermal CD1adimCD141+, or dermal CD14+ DCs was measured after 7 days by CFSE dilution using flow cytometry. The graph shows the frequency of the CFSEloCD3+CD4+ T cells (n = 10). Mean ± SD ± SEM for CD5+: 39.5% ± 19.8% ± 6.6%, CD5–: 22.9% ± 17% ± 7.6%, CD141+ DCs: 19.5% ± 17% ± 7.6%, CD14+ DCs: 5% ± 4.4% ± 1.65%. (B) CFSE-labeled sorted naive CD4+ T cells cultured for 6 days with CD40L-activated dermal CD1adimCD5+ or CD1adimCD5– DCs. CFSE dilution and cytoplasmic expression of IFN-γ and IL-22 were analyzed by flow cytometry after 5-hour stimulation with PMA and ionomycin. (C) The plot shows the frequency of IL-22–producing CD4+ T cells that were primed by the different skin DC subsets (n = 10). Top: The plot shows the frequency CD4+ T cells that diluted CFSE and express IL-22. Bottom: The plot shows the frequency of IFN-γ and IL-22–producing CFSEloCD4+ T cells. Data are representative of 7 independent experiments. (D) CFSEloCD4+ T cells, primed by either dermal CD1adimCD5+ or CD5– DCs, were sorted and restimulated with anti-CD3 and anti-CD28 mAbs for 18 hours. IL-22 and IFN-γ were measured by a Luminex multiplex bead assay (n = 3). One of 3 experiments is shown. Data represent mean ± SEM; **P < 0.01, ***P < 0.005, ****P < 0.0001 by paired Student’s t tests (A and C) or unpaired Student’s t tests (D).

