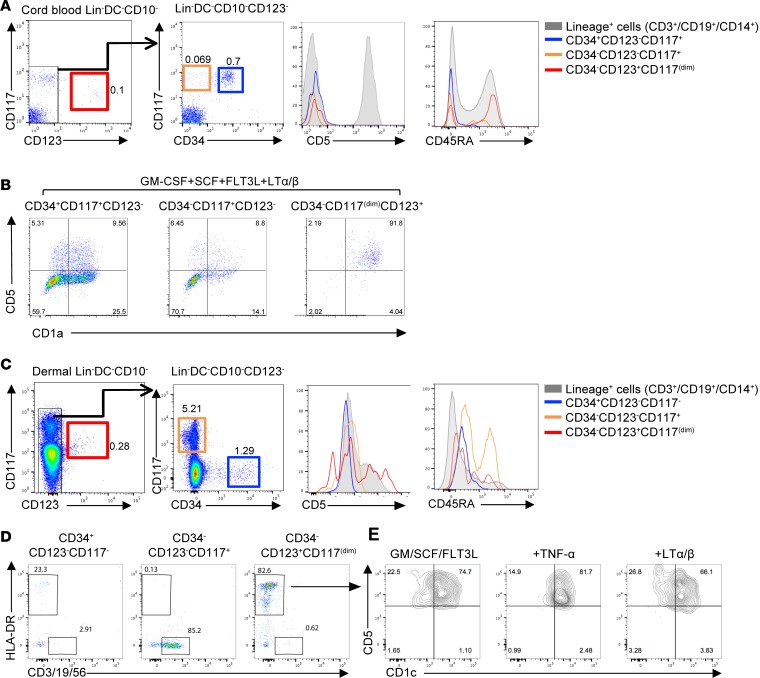
Figure 7. CD34–CD123+CD117dimCD45RA+ cells preferentially give rise to CD5+ DCs.
(A) Gating strategy for cord blood progenitors. Cells were sorted as Lin–DC–CD10–CD123– (see also Supplemental Figure 3): CD34+CD117+ (blue); CD34–CD117+ (orange); or Lin–DC–CD10–CD123+CD34–CD117dimCD45RA+ (red). Histograms show the expression of CD5 and CD45RA on the different progenitor subsets. Expression on lineage+ cells is shown as a control (gray). (B) Sorted cord blood CD34+CD123–CD117+, CD34−CD123–CD117–, or CD34−CD123+CD117dim progenitors were cultured in the presence of GM-CSF, SCF, FLT3-L, and LTα/β. Flow cytometry plots, gated on live CD45+HLA-DR+CD11c+ cells, show culture output of CD1a+CD5+ DCs on day 7. Representative results of 4 independent experiments are shown. (C) Gating strategy for dermal progenitors. Cells were sorted as Lin–DC–CD10– that were CD34+CD123–CD117– (blue); CD34–CD123–CD117+ (orange); or CD34−CD123+CD117dim (red). Histograms show the expression of CD5 and CD45RA on the different progenitor subsets. (D) CD34+CD123–CD117–, CD34−CD123–CD117+, or CD34−CD123+CD117dim were isolated from human dermis. Flow cytometry plots are gated on live CD45+HLA-DR+CD11c+ cells and show the expression of HLA-DR+ or lineage+ cells that were differentiated from the different progenitors. (E) The plots show the expression of CD1c and CD5 on HLA-DR+ cells that differentiated from CD34−CD123+CD117dim cells for 7 days in the presence of in the presence of GM-CSF (GM), SCF, and FLT3-L (FL) and either TNF-α or LTα/β. Representative results of 3 independent experiments are shown.

