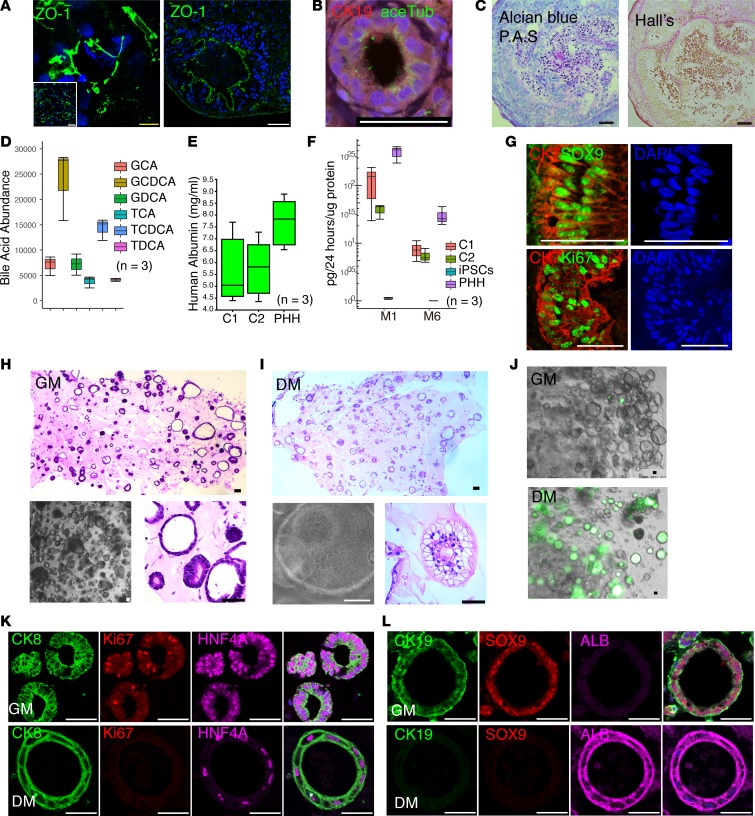
Figure 2. HOs have morphological and functional similarities to human liver.
(A) Immunostained sections prepared from day 20 and 50 HO1s show that they express ZO-1. The insert (bottom left) shows a low-power view of the field that is enlarged in the right image. (B) Immunostaining with an antibody against acetylated α-tubulin indicates that primary cilia are present in a CK19+ cholangiocyte adjacent to a ductal structure in the HO1. (C) Day 50 HO1s were stained with Alcian blue and periodic acid–Schiff stain for mucus and glycogen (upper), and by Hall’s method, which stains a bile component (bilirubin) green after it is oxidized to biliverdin (lower). (D) The abundance of the following bile acids were measured in the supernatants of a day 50 HO1: glycochenodeoxycholic acid (GCDCA), glycodeoxycholic acid (GDCA), glycocholate (GCA), taurochenodeoxycholate (TCDCA), taurocholate (TCA), and taurodeoxycholate (TDCA). The red dashed line indicates the amounts of the corresponding bile acids measured in the supernatants of 3 different control iPSC lines (all were below the level of quantification). Each measurement is the mean ± SD of 3 supernatants, and was normalized relative to that of iPSC supernatants. (E) The human albumin levels in supernatants obtained from day 50 HO1s and PHHs. The supernatants were collected after 24 hours, and the measurements were normalized per 106 cells. (F) The amounts of 2 clemizole metabolites (M1, M6) produced by day 50 control (C1, C2) organoid cultures were measured 24 hours after incubation with clemizole (3.6 μg/ml). The amount of metabolites produced by recently plated PHH and iPSC lines was also measured. (G) Confocal images show the cells that surround luminal structures in day 50 organoids. The cells were stained with antibodies against CK7 (red) and SOX9 (green) (upper), or with antibodies against CK7 (red) and Ki67 (green) (lower), and were counterstained with DAPI (blue). (H and I) H&E staining and bright-field images show HO2s on day 6 in growth medium (GM) regenerated from dissociated HO1s (lower and higher magnification) (H), or HO2s on day 12 in differentiation medium (DM) (lower and higher magnification) (I). The lower panel is enlarged to show a single HO2. (J) Fluorescence and bright-field merged images show that there is abundant bile acid accumulation in the lumen of HO2s after differentiation. (K and L) Confocal images examining the expression of liver lineage markers by HO2s in GM or DM. Scale bars: 50 μm.

