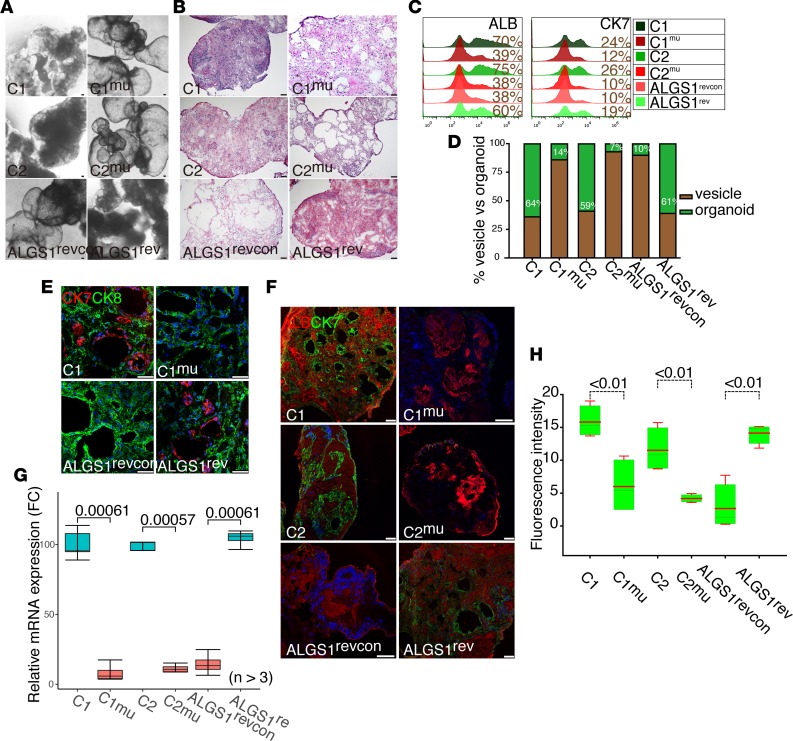
Figure 5. Characterization of iPSC lines with a CRISPR-engineered ALGS1 mutation (C829X).
(A and B) Bright-field images and H&E–stained cryosections of day 25 HO1 cultures. The cultures were generated from 2 control (C1, C2) iPSC lines prepared and from the following CRISPR-engineered iPSC: C1mu and C2mu, which have the heterozygous C829X mutation; ALGS1rev, where the ALGS1 mutation was reverted to wild type; and ALGS1revcon, which has the ALGS1 mutation but is a control for the genome engineering process. (C) Flow cytometric analyses showing the proportion of cells expressing hepatocyte (ALB) or cholangiocyte (CD26, CK7, CK19, and CFTR) markers in day 20 HO1s prepared from C1, C1mu, C2, C2mu, ALGS1rev, and ALGSrevcon iPSC lines. (D) The JAG1 allele determines the efficiency of formation of intact HO1s. The number of fluid-filled vesicles and intact organoids in HO1 cultures generated from the indicated iPSC lines was measured on day 30. The proportion of fluid-filled vesicles formed by iPSCs with a mutated JAG1 (C1mu, C2mu, ALGSrevcon) was much greater than by those with an un-mutated JAG1 (C1, C2, ALGS1rev). Each bar is the average of 3 independent determinations, and each culture had more than 100 evaluable structures. (E and F) Immunofluorescence staining of the HO1 cultures with anti–human albumin, anti–human CK8, and anti–human CK7 antibodies. The sections were also stained with DAPI to indicate the nuclei. Irrespective of whether they had a normal or mutated JAG1 allele, all HO1s expressed albumin and CK8. However, CK7+ cholangiocytes are only abundant in HO1s prepared from lines (C1, C2 or ALGS1rev) with a wild-type JAG1. Each analysis was reproduced in 3 independent experiments. (G) Quantitative RT-PCR analysis of JAG1 mRNA expression in day 9 HO1s prepared from different iPSCs. Each bar is the average of 3 independent cultures, and the results were normalized relative to control iPSCs. JAG1 mRNA levels were 10-fold lower in C1mu, C2mu, and ALGS1revcon HO1s relative to wild-type HO1s (P < 0.01), but unaltered in ALGS1revcon iPSCs (P > 0.05). FC, fold change. (H) The fluorescence intensity within the lumina of the indicated HO1 was normalized relative to the area. The red line is the average of 3 independent measurements, and the box indicates the first and third quartiles. All HO1s with a JAG1 mutation were significantly impaired in their ability to transport rhodamine 123 into the ductal lumen. Scale bars: 50 μm (all panels).

