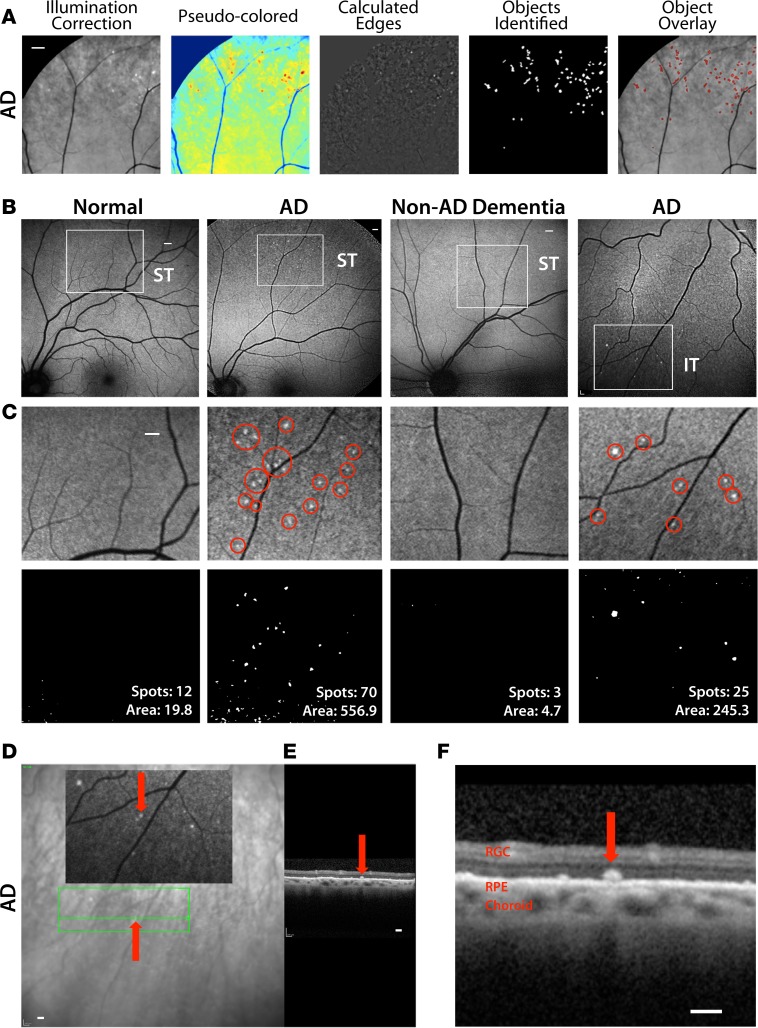
Figure 7. Noninvasive detection of retinal amyloid deposits in live AD patients.
(A) Multistep manual postacquisition image processing and analysis to detect and quantify spots with increased curcumin fluorescence signal in the retina (superior quadrant; representative images of n = 16 human subjects). Scale bar: 800 μm. (B) Representative images demonstrate detection of retinal curcumin spots in two live AD patients and contrasting minimal spots in a healthy control (Normal) and patient suffering from vascular dementia (Non-AD Dementia). Curcumin fluorescence fundography of superior temporal region (ST) reveals amyloid deposits often in retinal peripheries. Amyloid deposit detection in inferior temporal (IT) region of another AD patient. Regions of interest are indicated by white squares. Scale bar: 400 μm. (C) Higher-magnification image of the above regions of interest. Red circles in the top images highlight retinal spots of curcumin-increased fluorescence. Scale bar: 400 μm. Bottom images display postprocessing spot number and fluorescent area (μm2). (D and E) Representative optical coherence tomography (OCT) of a selected curcumin-positive region in an AD patient with no maculopathy (repeated experiments in n = 3 patients). Scale bar: 200 μm. (D) Curcumin fluorescence fundography indicating certain retinal amyloid plaque with red arrows. Green lines delineate region of OCT segmentation. (E) Retinal cross section by OCT reveals amyloid plaque in outer retinal layers. (F) High-magnification OCT image displays curcumin-positive deposit located above retinal pigment epithelium (RPE), along with intact RPE and Bruch’s membrane.

