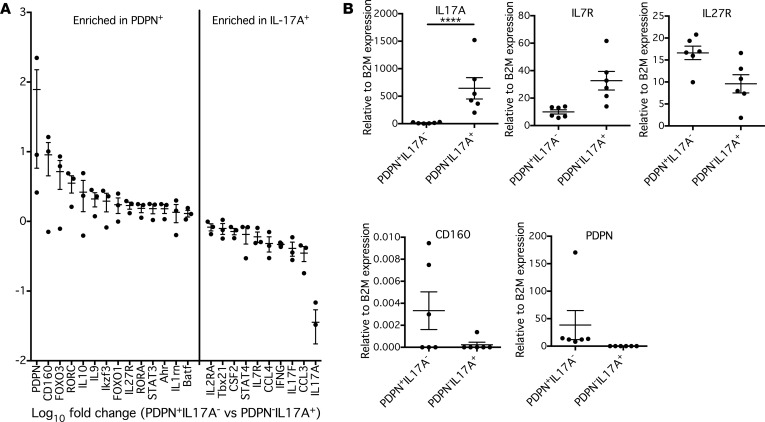
Figure 2. PDPN+ T cells have a more regulatory mRNA expression profile.
(A) Naive CD4+ T cells were cultured for 1 week under Th17-polarizing conditions, and then were stained and resorted on a FACSAria based on cell surface expression of PDPN and IL-17A. mRNA was isolated from these populations, hybridized to a custom-made NanoString Codeset, and quantitative mRNA expression profiles were generated. n = 3. (B) Expression of selected genes relative to β2-microglobulin (β2M) was assessed in an independent group of subjects by quantitative PCR and analyzed by 2-way ANOVA with Sidak’s multiple comparisons test. ****P < 0.0001. n = 6. Graphs show mean ± SEM.

