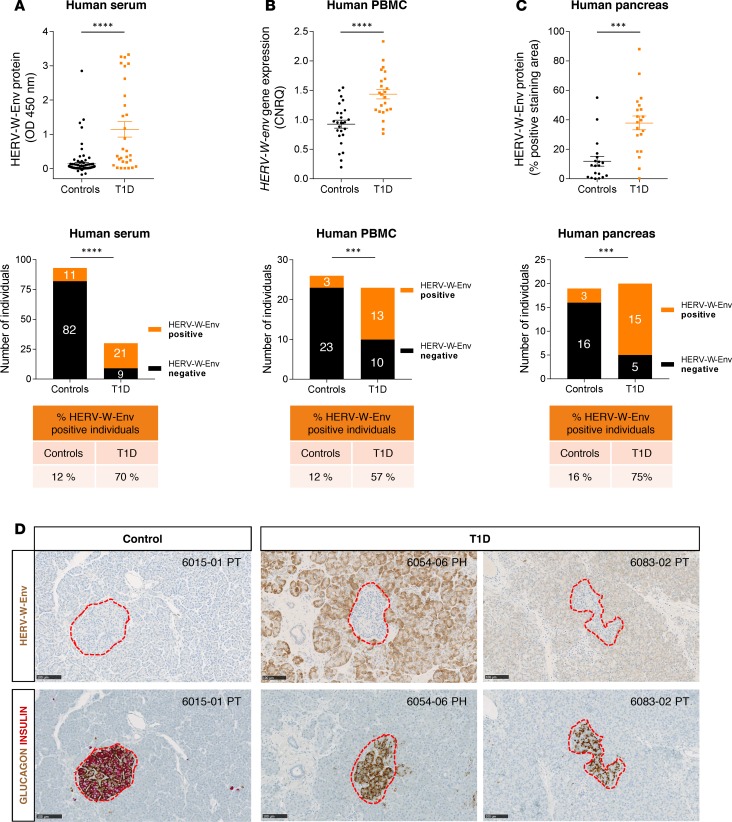
Figure 1. HERV-W-Env is expressed in human T1D patients.
(A) Serum from controls (n = 93) and T1D (n = 30) were analyzed by sandwich ELISA using monoclonal antibodies raised against HERV-W-Env. Each sample has been tested in triplicate. Results are presented as mean of the triplicate for each donor and as mean ± SEM for each group. Significance determined by Mann Whitney U test. (B) PBMC RNA was extracted from controls (n = 26) and T1D (n = 23) and analyzed by qRT-PCR assay. HERV-W-env expression was normalized to housekeeping genes B2M and YWHAZ using qbase+ and is expressed as calibrated normalized relative quantities (CNRQ). Each qPCR was done in duplicate, individual CNRQ values are plotted, and mean ± SEM for each group is shown. Significance determined by unpaired t test. (C) HERV-W-Env expression was assessed on pancreas slices from controls (n = 19) and T1D (n = 20) stained using GN_mAb_Env03 and automatically quantified. The HERV-W-Env positive area was reported to the total pancreatic tissue area. Two slides per individuals were quantified — one in the head and one in the tail. Results are presented as mean of the 2 slides for each donor and as mean ± SEM for each group. Significance determined by Mann Whitney U test. Individuals from cohorts presented in A–C were classified into either positive or negative groups for HERV-W-Env based on thresholds set at mean + 2 SD of control group. Cutoffs were set at 0.231 OD450nm for ELISA, at 1.356 CNRQ for qRT-PCR, and at 21.43% for pancreas IHC. Results are presented as contingency plots representing the number of individuals positive (in orange) or negative (in black). Significance determined by χ2 test. (D) Pancreas slices of three nPOD donors stained with GN_mAb_Env03 and adjacent slides coimmunostained with insulin (red) and glucagon (brown) are presented. Pancreatic Langerhans islets are highlighted with red dotted line. nPOD case ID is indicated in the upper right corner, with block number and pancreas zone (PH, pancreas head; PT, pancreas tail). Scale bars: 100 μm. ***P < 0.001, ****P < 0.0001.

