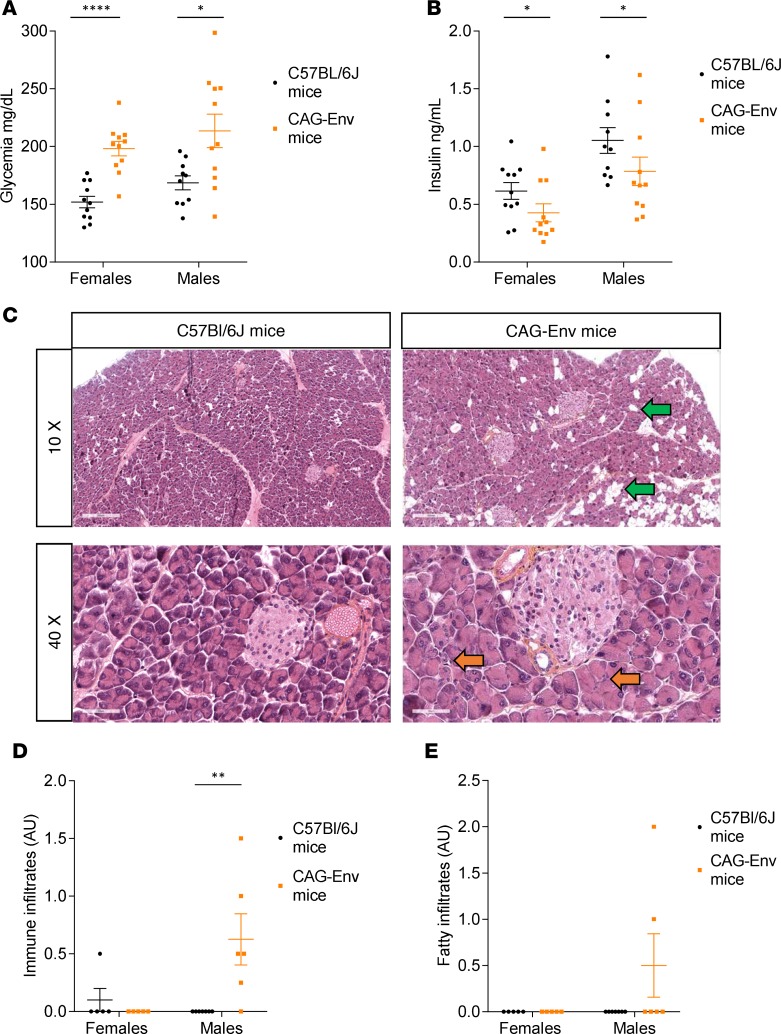
Figure 4. Transgenic mice expressing HERV-W-env display hyperglycemia and pancreatic abnormalities.
(A and B) Seven-week-old CAG-Env transgenic mice expressing of HERV-W-env and control C57Bl/6J mice of the same age were fasted for 5 hours before measuring glycemia (A) and insulinemia (B). Results are presented as individual values and as mean ± SEM. n = 10 or 11 mice in each group. Significance determined by unpaired t test (glycemia) or by Mann-Whitney U test, one-tailed (insulinemia). (C) Pancreas sections of 12-month-old CAG-Env mice (n = 5 females and n = 6 males) and C57BL/6J mice (n = 5 females and n = 7 males) were stained with HES (Hematoxylin Eosin Saffran). Representative images of C57BL/6J (left panels) and CAG-Env (right panels) mouse pancreata were presented at 10× (upper panels) and 40× (lower panels) original magnification. Fatty infiltrates are highlighted with green arrows and immune cells infiltrates with orange arrows. Scale bars: upper panels, 200 μm; lower panels, 50 μm. (D and E) Pancreas sections from 12-month-old CAG-Env mice (n = 5 females and n = 6 males) and C57BL/6J mice (n = 5 females and n = 7 males) were analyzed for immune cell infiltration (D) and fat infiltration (E). A gradation from 0–3 was affected to each slide, 0 corresponding to no infiltration of fat or immune cells and 3 corresponding to high level of infiltrations. Two sections distant by 500 μm were analyzed for each mouse, blindly and independently by 2 people, and their evaluations were averaged for each slide. Results are presented as mean of the 2 slides for each mouse and as mean ± SEM for each group. Significance was determined by Mann Whitney U test. *P < 0.05; **P < 0.01, ****P < 0.0001.

