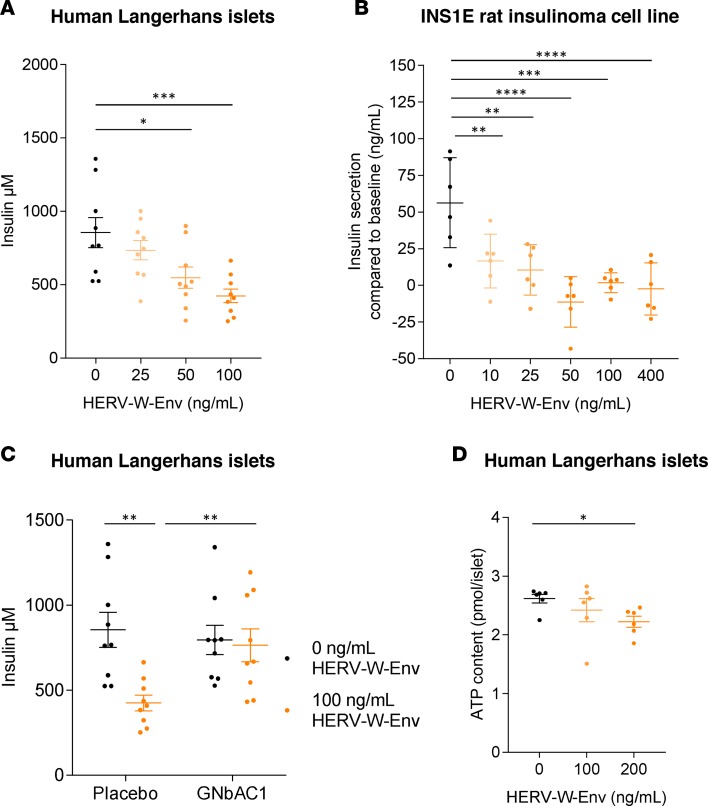
Figure 5. Direct pathogenic effects of HERV-W-Env toward pancreatic β cells.
(A) Human Langerhans islets have been exposed for 48 hours to HERV-W-Env (0, 25, 50, 100 ng/ml), and insulin secretion has been measured in response to 20 mM glucose stimulation. Results are presented as individual values and as mean ± SEM. Each condition has been performed in triplicate and in 3 independent experiments. Significance determined by Bonferroni’s test. (B) INS1E cells have been exposed for 72 hours to increasing concentrations of HERV-W-Env (0, 10, 25, 50, 100, 400 ng/ml). Insulin secretion has been measured either in absence of glucose (baseline) or in response to 10 mM glucose stimulation. Results are presented as the difference in concentration between glucose stimulation and baseline. Each condition has been performed in triplicate and in 2 independent experiments, and data are presented as individual values and as mean ± SEM. Significance determined by Bonferroni’s test. (C) Human Langerhans islets have been exposed for 48 hours to HERV-W-Env (0 and 100 ng/ml) and to GNbAC1 (3 μg/ml) or placebo. Insulin secretion has been measured in response to 20 mM glucose stimulation. Results are presented as individual values and as mean ± SEM. Each condition has been performed in triplicate and in 3 independent experiments. Significance determined by unpaired t test. (D) Effect of HERV-W-Env on human Langerhans islet viability has been assessed using human islet microtissues exposed to 0, 100, and 200 ng/ml of HERV-W-Env for 48 hours before being lysed. Lysates were analyzed for ATP content using Promega CellTiter-Glo Luminescent Cell Viability Assay. Results are presented as individual values and as mean ± SEM. Each condition has been performed six times, and 1 experiment has been performed. Significance determined by Dunn’s test. *P < 0.05, **P < 0.01, ***P < 0.001, ****P < 0.0001.

