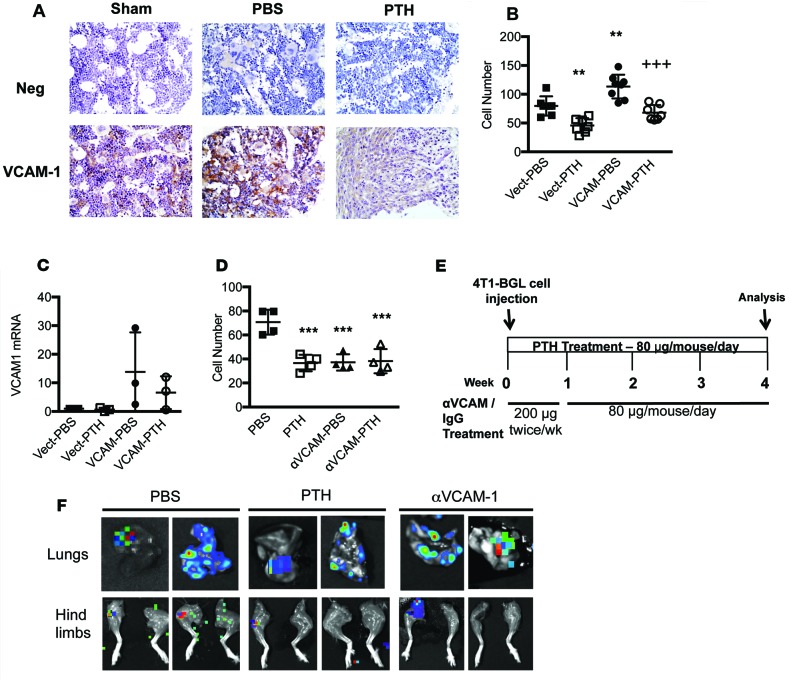
Figure 8. Decrease in VCAM-1 expression reduces the migratory potential of 4T1 breast cancer cells both in vitro and in vivo.
(A) Representative VCAM-1 staining in sham-, PBS-, and PTH-treated tibiae with 4T1 cells (original magnification, ×40) (n = 6). (B) Numbers of 4T1 cells that migrated towards MC3T3-E1 cells overexpressing VCAM-1 treated with intermittent PTH or PBS in Transwell assays (n = 8). (C) Vcam1 mRNA levels in MC3T3-E1 cells overexpressing VCAM-1 and treated with intermittent PTH or PBS. (D) Numbers of 4T1 cells that migrated towards MC3T3-E1 cells treated with VCAM-1–neutralizing antibody (20 μg/ml) and intermittent PTH in Transwell assays (n = 5). (E) In vivo treatment with anti-VCAM-1 antibody experimental design (n = 10). (F) Representative BLI images of metastases to lungs and hind limbs. All values represent mean ± SD of at least 3 individual experiments conducted in triplicate. **P < 0.01, ***P < 0.001 when compared with PBS group. +++P < 0.001 when compared with VCAM-PBS group, by 1-way ANOVA with Bonferroni’s test as post-hoc analysis.

