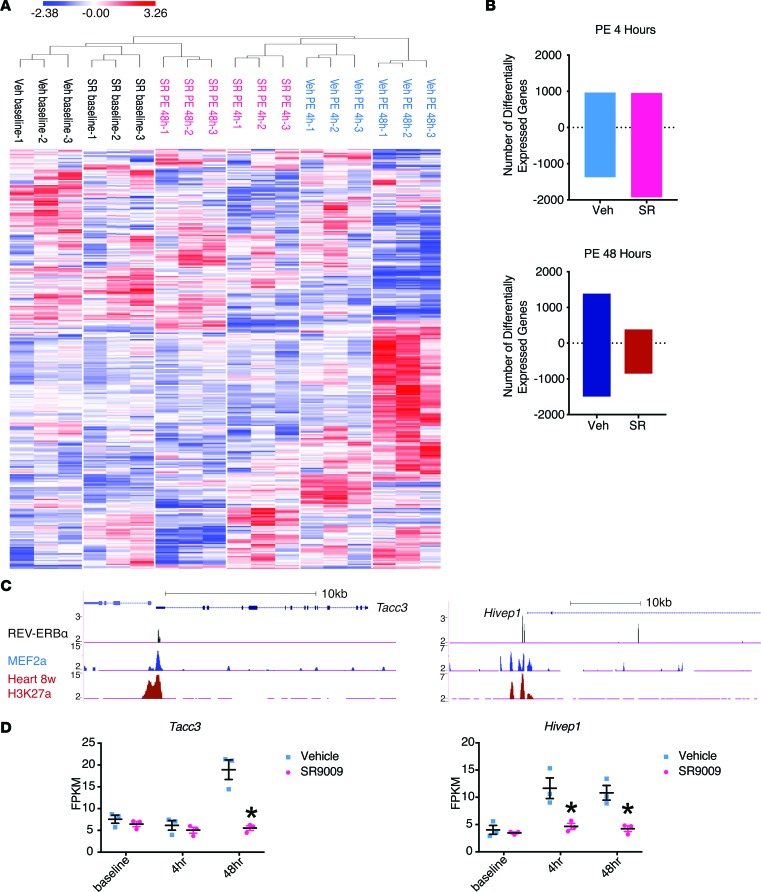
Figure 3. REV-ERBα regulates gene program during cardiomyocyte hypertrophy in vitro via transcription repression.
(A and B) RNA-Seq analysis. Neonatal rat ventricular myocytes (NRVMs) were pretreated with vehicle (Veh) or SR9009 (SR) for 24 hours and then treated with phenylephrine (PE) for 48 hours. Samples were collected at 0, 4, and 48 hours after PE treatment. n = 3. (A) Heat map with unsupervised hierarchical clustering. Three hundred and twenty-four genes from all the pathways showing a pairwise differential expression, defined by FWER, P < 0.250. (B) The number of differentially expressed genes comparing to vehicle baseline. The number of upregulated genes are shown as positive, and the number of downregulated genes are shown as negative. (C) ChIP-Seq gene tracks from REV-ERBα (black), MEF2a (blue), and H3K27a (red). MEF2 data is a previously published result from HL-1 cells. H3K27a is part of the ENCODE data from adult mice hearts (28, 29). (D) Fragments per kilobase of transcript per million mapped reads (FPKM). *P = 0.013 (Tacc3), *P = 0.047 (Hivep1 4 hr), *P = 0.031 (Hivep1 48 hr), n = 3. Statistical differences were determined by 2-tailed Student’s t test. Data are presented as mean ± SEM. Multiple comparison is corrected for by using Holm-Sidak method, with α = 0.05.

