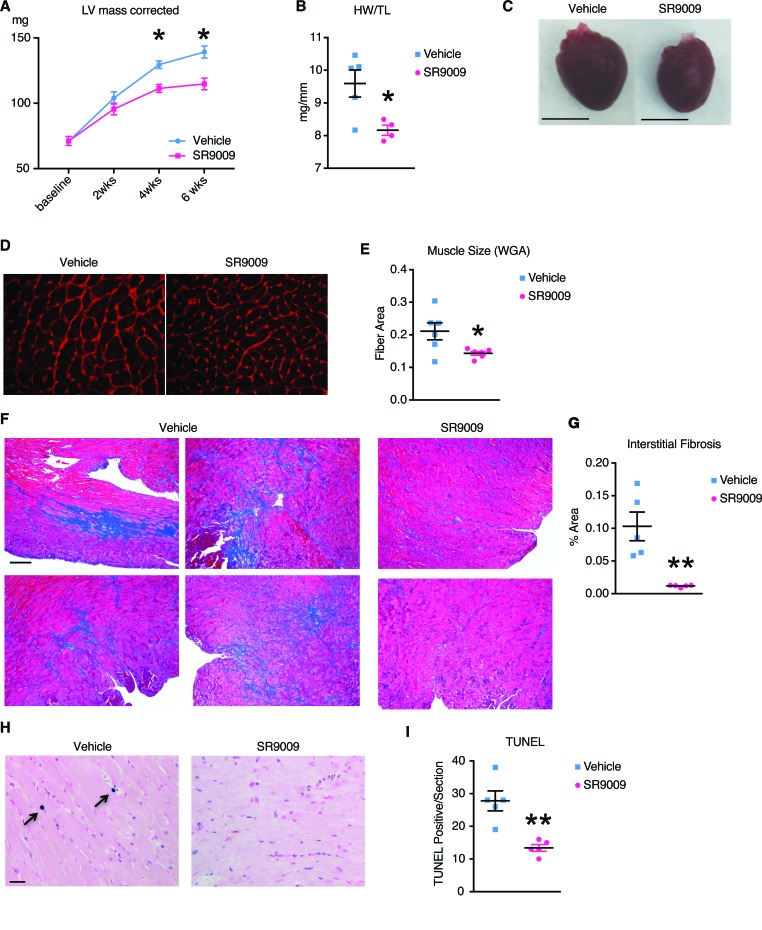
Figure 6. REV-ERB agonist ameliorate cardiac hypertrophy in pressure overload models.
Six-week followup of 27-gauge TAC was performed on 8-week-old mice, vehicle, or SR9009, which were given daily starting one day after surgery. n = 5. (A) Left ventricle mass, corrected, *P < 0.05. (B) Heart weight normalized to tibia length, *P < 0.05. (C) Representative pictures of vehicle- and SR9009-treated hearts harvested at 6 weeks. Scale bar: 5 mm. (D) Wheat germ agglutinin staining. Scale bar: 30 μM. (E) Quantified muscle fiber size in arbitrary units, *P < 0.05. 41. (F) Fibrosis stained with Gomori Trichrome stain, representative pictures. Vehicle, left column and middle column. SR9009, right column. Scale bar: 400 μM. (G) Quantification of fibrotic area. (H) TUNEL staining, representative picture. Scale bar: 20 μM. (I) Quantification of TUNEL signal per section. Statistical differences were determined by 2-tailed Student’s t test. Data are presented as mean ± SEM. Multiple comparison is corrected for by using Holm-Sidak method, with α = 0.05.

