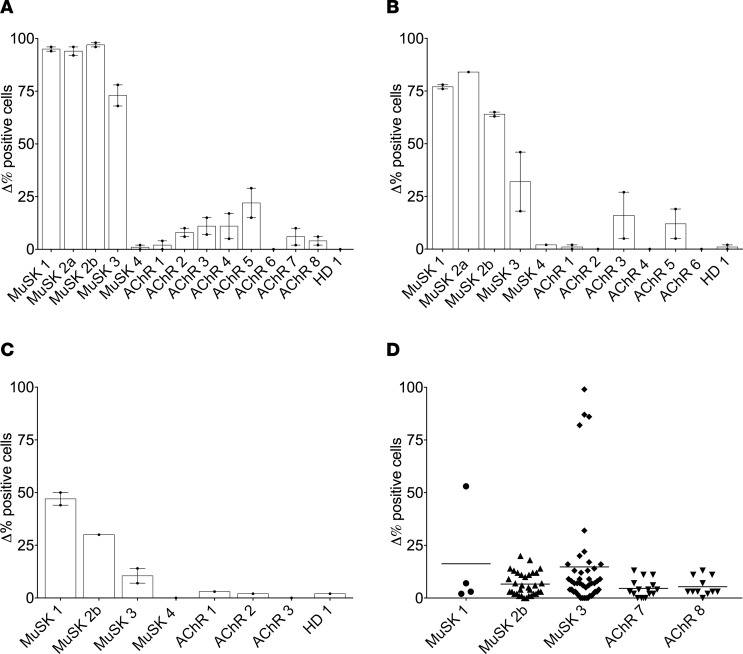
Figure 2. Summary of MuSK CBA data performed with sera, B cell culture supernatants, and recombinant immunoglobulin (rIg).
Results are presented as Δ% positive cells on the y axis. Δ% positive cells = (%frequency of positive MuSK-GFP–transfected cells/%frequency of MuSK-GFP–transfected cells) – (%frequency of positive GFP-transfected cells/%frequency of GFP-transfected cells). Testing of all samples was performed in duplicate. (A–C) Bars represent means, dots represent individual values, and error bars represent range of values; (D) lines represent means, and dots represent individual rIg values. (A) Sera of MuSK 1–4, AChR 1–8, and HD 1; (B) CD27+ B cell culture supernatants of MuSK 1–4, AChR 1–6 and HD 1; (C) Plasmablast culture supernatants from MuSK 1, -2b, -3, -4, AChR 1–3 and HD 1; (D) Plasmablast-derived rIg from MuSK 1 (n = 4), 2b (n = 33), 3 (n = 45) and AChR 7 (n = 15), 8 (n = 11). AChR, acetylcholine receptor; HD, healthy donor; MuSK, muscle-specific tyrosine kinase.

