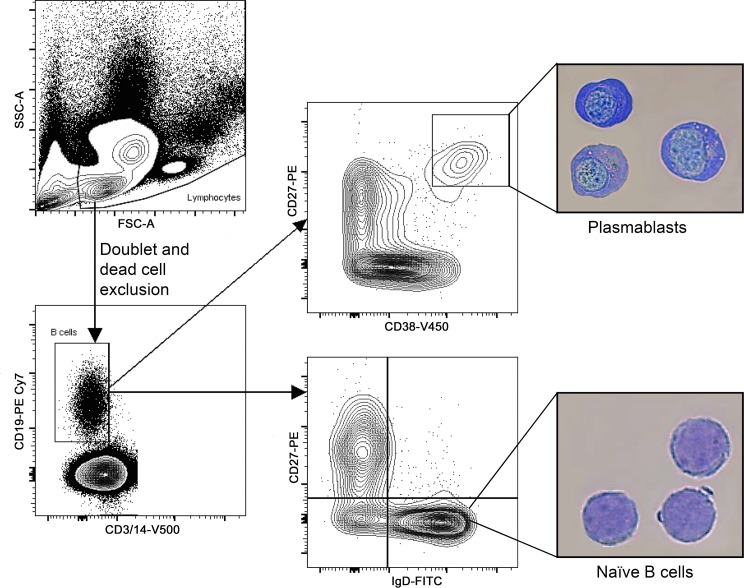
Figure 3. Plasmablast FACS gating strategy and validation.
A representative example of the plasmablast population sorting strategy is shown. PBMCs were initially gated in the SSC/FSC graph (upper left). The SSC/FSC gate was determined based on plasmablast back-gating (not shown). After doublet and dead cell exclusion, CD19+CD3–CD14– cells were gated as B cells (lower left). Plasmablasts were subsequently gated from the B cell gate as CD27hiCD38hi cells (upper right). Naive B cells were defined as IgD+CD27– B cells (lower right). Morphological analysis (400× magnification) is shown for plasmablasts (upper picture) and naive B cells (lower picture). Plasmablasts display an eccentric nucleus, perinuclear hof region, prominent nucleoli, and abundant cytoplasm. In contrast, naive B cells display a large nucleus with a thin rim of cytoplasm. These results were replicated in a repeat experiment. FSC, forward scatter; PBMC, peripheral blood mononuclear cells; SSC, side scatter.

