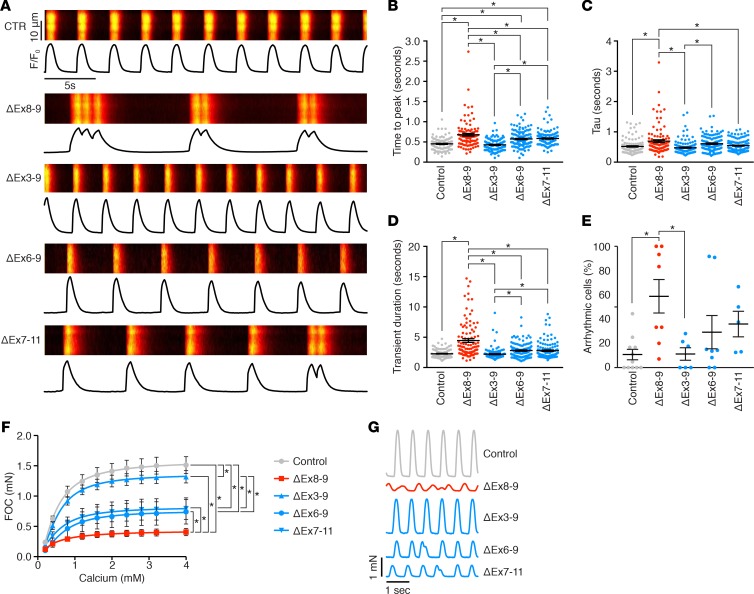
Figure 5. Functional analysis of iPSC-derived cardiomyocytes.
(A) Representative recordings of spontaneous Ca2+ activity of induced pluripotent cell–derived (iPSC-derived) cardiomyocytes loaded with Ca2+ indicator Fluo-4AM. Traces show change in fluorescence intensity (F) in relationship to resting fluorescence intensity (Fo). (B) Relative time to peak (TTP), (C) decay (τ), and (D) transient duration (TD), as measured by calcium imaging. (E) Arrhythmic iPSC–derived cardiomyocytes were identified based on calcium activity. For all corrected iPSC-derived cardiomyocyte lines (B–E), data were obtained from 2 independent clones. n = 113 for control; n = 105 for ΔEx8-9 iDMD; n = 129 for ΔEx3-9; n = 121 for ΔEx6-9; and n = 122 for ΔEx7-11 iPSC–derived cardiomyocyte lines from 5–11 independent experiments. Data are represented as mean ± SEM. *P < 0.05 by one-way ANOVA. (F) Force of contraction (FOC) recorded in EHM under isometric conditions in the presence of increasing extracellular Ca2+. EHM generated from 2 independent control lines (n = 8), ΔEx8-9 iDMD (n = 6), ΔEx3-9 (n = 14), ΔEx6-9 (n = 3), and ΔEx7-11 (n = 3). *P < 0.05 by two-way ANOVA and Tukey’s post-hoc test. (G) Representative recordings of EHM contractions from the indicated groups (same EHM as in F). Data are represented as mean ± SEM.

