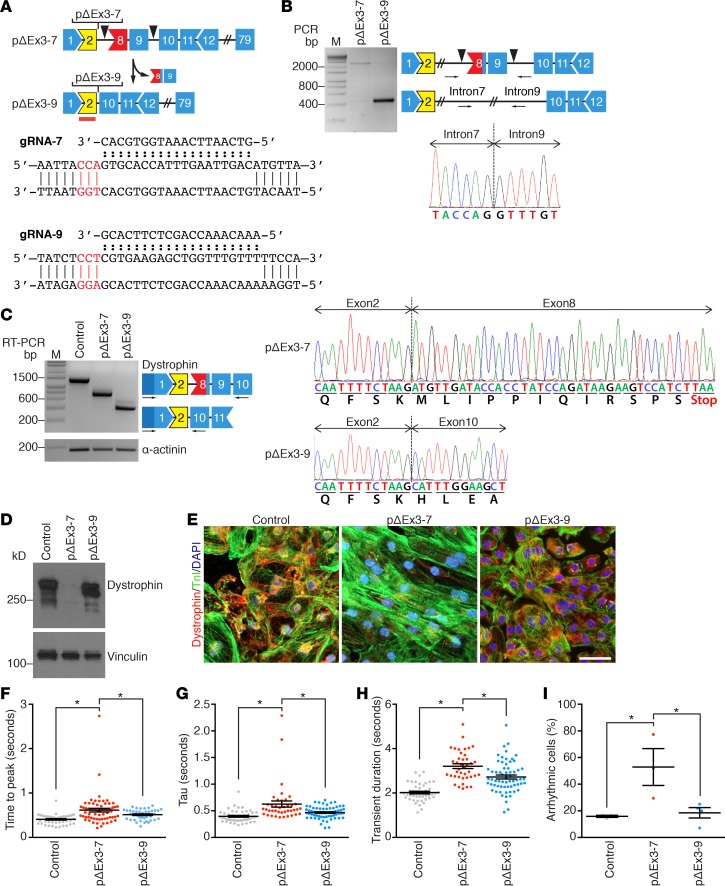
Figure 6. Correction of DMD patient–derived iPSCs by deleting exons 8 and 9.
(A) Strategy showing CRISPR/Cas9-mediated genomic editing of DMD (Duchene muscular dystrophy) patient (pΔEx3-7) to generate corrected pΔEx3-9 induced pluripotent cell (iPSC) line. Shape and color of boxes denoting DMD exons indicate reading frame and protein coding domains. Yellow designates ABD-1. Blue marks part of central rod domain. Red lines indicate ABS1. Arrowheads mark targeting sites of guide RNAs (gRNAs). Red box marks exon with stop codon. Sequences of gRNAs and their targeting sites within intron 7 (top) and intron 9 (bottom). gRNAs were designed to target the 3′ region of intron 7 (gRNA-7) and 5′ region of intron 9 (gRNA-9). PAM sites are highlighted in red. (B) PCR genotyping of pΔEx3-7and pΔEx3-9 iPSC lines using primers upstream and downstream of the gRNA targeting sites. Sequencing of PCR product of pΔEx3-9 validates splicing of intron 7 to intron 9. PCR primers are indicated by arrows. Arrowheads mark targeting sites of gRNAs. M denotes marker lane. (C) RT-PCR analysis of dystrophin mRNA expression in control, pΔEx3-7, and pΔEx3-9 iPSC–derived cardiomyocytes. Forward primer targeting 5′UTR and reverse primer targeting exon 10 were used. Sequencing of pΔEx3-7 confirmed splicing of exon 2 to exon 8, introducing a stop-codon. Sequencing pΔEx3-9 confirmed splicing of exon 2 to exon 10, restoring the open reading frame. α-Actinin was used as loading control. (D) Western blot analysis showing dystrophin protein expression in iPSC-derived cardiomyocytes using anti-dystrophin antibody. Vinculin was used as loading control. n = 7 for control, n = 3 for pΔEx3-7, and n = 3 for pΔEx3-9. (E) Immunocytochemistry representations of iPSC-derived cardiomyocytes with anti-dystrophin (red) and anti–troponin I (green). Nuclei are stained with Hoechst 33342 (blue). Scale bar: 50 μm. n = 4 for control, n = 2 for pΔEx3-7, and n = 2 for pΔEx3-9. (F) Relative time to peak (TTP), (G) decay (τ), (H) transient duration (TD), and (I) percent of arrhythmic cells were measured based on calcium activity of control (n = 45), DMD patient pΔEx3-7 (n = 40), and corrected pΔEx3-9 (n = 65) iPSC–derived cardiomyocytes from 3–5 independent experiments. Data are represented as mean ± SEM. *P < 0.05 by one-way ANOVA (F–H).

