Abstract
Both linear (alin) and rotational (arot) accelerations contribute to head impacts on the field in contact sports; however, they are often isolated in injury studies. It is critical to evaluate the feasibility of estimating brain responses using isolated instead of full degrees-of-freedom (DOFs) accelerations. In this study, we investigated the sensitivities of regional brain strain-related responses to resultant alin and arot as well as the relative contributions of these acceleration components to the responses via random sampling and linear regression using parameterized, triangulated head impacts with kinematic variable values based on on-field measurements. Two independently established and validated finite element models of the human head were employed to evaluate model consistency and dependency in results: the Dartmouth Head Injury Model (DHIM) and Simulated Injury Monitor (SIMon). For the majority of the brain, volume-weighted regional peak strain, strain rate, and von Mises stress accumulated from the simulation significantly correlated to the product of the magnitude and duration of arot, or effectively, the rotational velocity, but not to alin. Responses from arot-only were comparable to the full-DOFs counterparts especially when normalized by injury-causing thresholds (e.g., volume fractions of large differences virtually diminished (i.e., <1%) at typical difference percentage levels of 1–4% on average). These model-consistent results support the inclusion of both rotational acceleration magnitude and duration into kinematics-based injury metrics, and demonstrate the feasibility of estimating strain-related responses from isolated arot for analyses of strain-induced injury relevant to contact sports without significant loss of accuracy, especially for the cerebrum.
Keywords: Traumatic brain injury, Contact sports, Concussion, Finite element model, Rotational acceleration, Linear acceleration, Injury metrics
1. Introduction
Sports-related concussion is a major public health problem in the United States estimated to occur in 1.6–3.8 million individuals annually (CDC 2003). Despite the significance and growing concerns about its potential long-term consequences, the biomechanical mechanisms of concussion remain elusive. Initial efforts used the head injury criterion (HIC) to assess the risk of skull fracture and severe traumatic brain injury (TBI) and included linear but not rotational acceleration. Therefore, its use as an injury metric for sports concussion has been controversial because many believe rotational acceleration to be a primary mechanism for diffuse brain injury (DAI), including loss of consciousness and concussion (King et al., 2003). Consequently, more recent injury metrics typically include rotational accelerations, including, e.g., a generalized acceleration model for brain injury threshold (GAMBIT; Newman et al., 1986), head impact power (HIP; Newman et al., 2000), and the HIT severity profile (HITsp; Greenwald et al., 2008). Notably, injury metrics such as the Brain Injury Criterion (BRIC; Takhounts et al., 2011), the Rotational Injury Criterion (RIC) and Power Rotational Head Injury Criterion (PRHIC) based on the HIC and HIP counterparts, respectively (Kimpara and Iwamoto 2012), are solely composed of rotational components from the six degrees-of-freedom (DOFs) head impact. These efforts are in-line with the work by Rowson and colleagues who investigated the rotational head kinematics as an injury risk function in football (Rowson et al., 2012), while later they extended their work by combining both linear and rotational kinematics to assess the probability of concussion (Rowson and Duma, 2013).
To date, however, no consensus has been reached on an appropriate injury metric or a tolerance threshold for sports-related concussion. In part, this may be because kinematics-based injury measures, alone, do not provide the region-specific tissue-level mechanical responses of the brain that are presumed to be directly responsible for initiating the injury. To bridge the gap between macro-scale kinematic measures and micro-scale injury findings describing injury-causing mechanical loading environment (Bain and Meaney 2002; Morrison et al., 2011), finite element (FE) models of the human head are playing an increasingly important role in simulating brain responses subjected to external impact (Yang et al., 2011). Using model-estimated brain responses, different research groups have attempted to establish a concussion threshold based on regional brain mechanical responses from analyses of reconstructed NFL football impacts (Zhang et al., 2004; Kleiven 2007; Marjoux et al., 2008), pedestrian (Marjoux et al., 2008) and motorcycle (Willinger and Baumgartner, 2003; Marjoux et al., 2008) accidents, and instrumented helmets from collegiate football players (Takhounts et al., 2008). Our recent work evaluating model-estimated brain responses for a group of athletes diagnosed with concussion based on on-field head impacts measured with the HIT system (Greenwald et al., 2008; Crisco et al., 2010) also showed promise in relating regional brain responses to longitudinal changes in neuroimaging parameters (McAllister et al., 2012).
Besides simulating real-world impacts, head FE models have also been used to parametrically investigate the significance of kinematic characteristics on brain responses. Weaver et al., 2012 employed the Simulated Injury Monitor (SIMon; Takhounts 2008) to assess the influence of direction and magnitude of rotational velocity on regional brain responses via cumulative strain damage measure (CSDM). Yoganandan et al., 2008 employed a 2D FE model to study the influence of rotational acceleration–deceleration pulse shapes on brain strain responses. They found nearly the same regional peak strains with monophasic acceleration or deceleration pulses, suggesting rotational velocity is a better injury metric than peak magnitude of rotational acceleration, which agrees with other findings based on linear regression analyses (Zhang et al., 2004; Kleiven 2007; Takhounts et al., 2008). However, when biphasic impulses were used, peak strains were region- and pulse-shape specific. Kleiven (2006) also evaluated the significance of global kinematics of linear and rotational accelerations on strain and reported a peak value of up to 1.5–3% maximum principal strain in the fringe plot when the head was subjected to linear acceleration alone. This finding was in concert with that from Zhang et al., 2006 who reported <2% maximum principal strain from linear acceleration alone while rotational acceleration was responsible for the majority of strain based on results from four individual elements in one lateral head impact simulation. The relatively insignificant strain from linear acceleration alone, however, was in sharp contrast to that reported in Post et al. (2012) in which regional maximum principal strains induced by linear acceleration was comparable to and often higher than those induced by rotational acceleration, for three acceleration pulse shapes applied in three major axes.
Most of these parametric studies isolate linear (alin) and rotational (arot) accelerations and report their significance independently. In addition, many studies analyzing real-world injury cases also employ isolated acceleration peak magnitudes to assess the risk of concussion (Zhang et al., 2004; Kleiven 2007; Takhounts et al., 2008; Beckwith et al., 2013; Rowson and Duma 2013). However, both alin and arot contribute to head impact kinematics on the field (Rowson et al., 2011). It is critical, therefore, to evaluate the feasibility of estimating regional brain responses that are presumably responsible for initiating the injury using isolated instead of full degrees-of-freedom (DOFs) head impacts (i.e., both alin and arot). Using laboratory-reconstructed (Pellman et al., 2003; Zhang 2004; Kleiven 2007), measured (Takhounts 2008), and simulated (Ji et al., 2013a) head impacts as biomechanical inputs to head FE models, studies have shown that alin and arot are correlated to intracranial pressure and strain responses, respectively. To date, however, there has not been a systematic study of the relative contributions of these acceleration components to brain responses. In this study, we parametrically investigate the sensitivities of regional strain-related responses to kinematic variables of alin and arot, and further quantify the relative contributions of these acceleration components to brain responses. These efforts are based on two independently established and validated FE models of the human head in order to evaluate model-consistency or any dependency in results. Findings from this study may provide important new insights on the biomechanical basis of sports-related concussion.
2. Methods
Conceptually, a head FE model is simply a mathematical function mapping impact kinematic input variables into regional brain response output parameters. The model-specific function is composed of the material properties of various intracranial components, interfacial boundary conditions, meshes, element formulations, and numerical simulation solver, etc. Because FE simulations are deterministic (i.e., a given set of input parameters leads to a unique output response), a random sampling technique with linear regression is readily applicable to analyze the sensitivity of output responses to head kinematic input parameters (Hamby 1994). In order to verify findings across models, two independently established and validated head FE models were employed in this study: the Dartmouth Head Injury Model (DHIM (Ji et al., 2013b); substantially improved over the previous version (McAllister et al., 2011; Ji et al., 2013a) and the SIMon (Takhounts et al. 2008); Fig. 1). A detailed description of the methodology for developing the DHIM was reported previously (Zhao et al., 2012). Briefly, the DHIM was constructed based on high-resolution MRI of a concussed athlete, and its validation against brain-skull displacement data from cadaveric head impacts was categorized as “good” or nearly “excellent” (Ji et al., 2013b) according to a fidelity rating (de Lange et al., 2005). For completeness, description of DHIM and its validation results are summarized in the Appendix. The SIMon was developed based on CT images of a single male individual with the head size close to that of 50th percentile male. Its validation against relative brain-skull displacements and pressure measured from cadaveric impacts was previously reported (Takhounts et al. 2008). A hyperelastic material model identical to the “average” model in Kleiven 2007 was used in DHIM, while a viscoelastic material model was adopted in SIMon. In total, the DHIM consists of 101.4 k nodes and 115.2 k elements (56.6 k nodes and 55.1 k elements) with a combined mass of 4.562 kg (1.436 kg) for the whole head (brain). By comparison, the SIMon consists of 42.5 k nodes and 45.9 k elements (33.4 k nodes and 30.1 k elements) with a combined mass of 4.506 kg (1.480 kg) for the whole model (brain).
Figure 1.
The DHIM (a and b) and SIMon (c and d) employed in this study with color-coded regions of interest (ROIs; cerebrum, cerebellum, and brainstem). The DHIM also includes part of the spinal cord to improve its biofidelity in the inferior region, which was excluded from analysis in this study.
2.1 Generation of Head Impact Kinematics
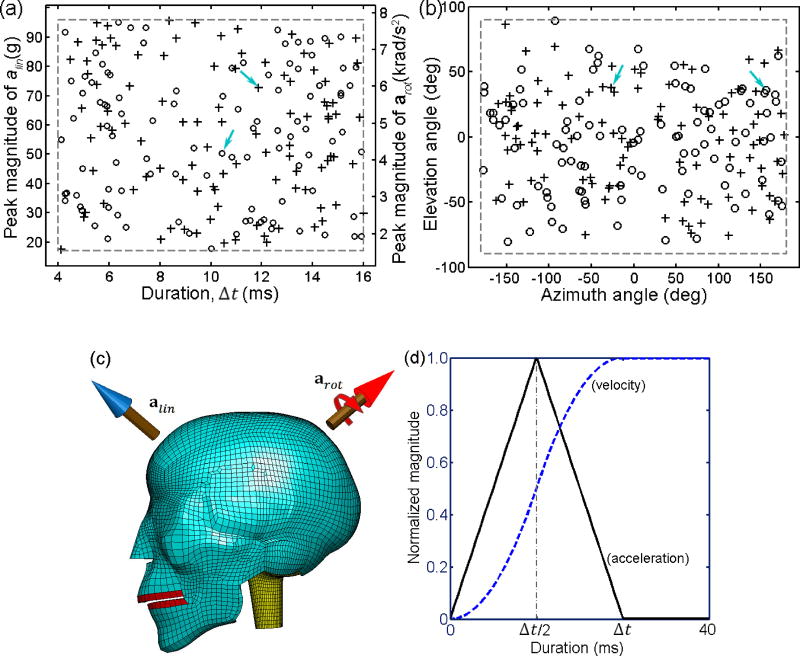
Triangulated alin and arot impulses were independently created to generate head impact kinematics. The magnitude of each acceleration component was determined from two independent variables: the peak magnitude ( and ) and impulse duration (Δtlin and Δtrot). Two additional variables, azimuth (θ) and elevation (α) angles, were used to determine the directionality of the translational and rotational axes ([θlin, αlin] and [θrot, αrot], respectively; Ji et al., 2013a). The ranges for and were based on the 50th and 99th percentile peak acceleration magnitudes in on-field ice-hockey (Ji et al., 2013a), which were comparable to the on-field measurements in youth, high school and collegiate football (Rowson et al., 2009; Rowson et al., 2012; Daniel et al., 2012). The impulse durations were based on temporal characteristics of high school football on-field measurements (mean plus and minus twice the standard deviation according to the reported 10±3 ms impact duration on average; Broglio et al., 2010), which encompassed the average impact duration of 14 ms reported in collegiate football (Rowson et al., 2009). No restriction was imposed on the directionality of the translational or rotational axis (Table 1). The peak magnitudes and impulse durations were randomly and independently generated within their respective ranges following a uniform distribution, while the pair of θ and α angles were independently generated such that their corresponding translational or rotational axis randomly and uniformly sampled the 3D space (i.e., instead of uniform distributions for each individual θ and α parameter; Fig. 2a and b). A unique head impact condition was then determined by combining each input variable with its value randomly selected from the corresponding pool (Fig. 2c). A total of 100 (N=100) head impact conditions were created to provide acceleration impulses for model input. For each impulse, a total of 40 ms time-varying acceleration profile was created that included the acceleration impulse followed by a “holding” period to maintain a constant velocity (i.e., to ensure that the brain peak response was reached which typically lagged behind the peak of acceleration impulse; Fig. 2d).
Table 1.
Summary of the impact parameterization variables and their ranges used in this study (g: 9.8 m/s2)
| Variable |
|
|
Δtlin | Δtrot | θlin, θrot | αlin, αrot | ||
|---|---|---|---|---|---|---|---|---|
| Range | 17–96 g | 1534–7812 rad/s2 | 4–16 ms | 4–16 ms | −180–180 deg | −90–90 deg |
Figure 2.
Distributions of the independent variables (peak magnitudes and durations in (a), and azimuth and elevation angles in (b)) used to generate head impact kinematics (cross: alin, circle: arot); (c) Illustration of a representative head impact condition (arrows in (a) and (b) identify the variable values used to combine and produce the head impact kinematics); (d) normalized acceleration and velocity temporal profiles. Kinematic variable values for the identified impact are: , Δtrot=10.2 ms, , Δtlin=10.9 ms, θrot=153.7 deg, αrot=33.5 deg, θlin=−26.3 deg, and αlin=37.5 deg.
2.2 Sensitivities of regional brain strain-related responses to alin and arot
Kinematic motion of the rigid skull was prescribed according to each impact condition through the head center of gravity using either DHIM or SIMon. Values of strain-related mechanical variables including the maximum principal engineering strain (ε), its rate (ε̇), and von Mises stress (σ) were extracted for each element at every temporal point (temporal resolution of 1 ms). The output variables used for data analyses were defined based on their element-wise peak values during the entire simulation regardless of the time of occurrence (analogous to the cumulative strain damage measure (CSDM) derived from “accumulated” peak responses; Takhounts et al., 2008), and were denoted by εp, ε̇p, and σp, respectively. Volume-weighted regional averages of these output variables for the whole-brain, cerebrum, cerebellum, and brainstem were obtained as dependent variables. By comparison, the independent variables included the individual parameters used to create the acceleration impulses (i.e., , Δtlin, , and Δtrot) as well as their respective interaction terms, and , or effectively, their respective linear and rotational velocities, νlin and νrot. Because the focus of our study is to examine the sensitivity of strain-related responses to alin and arot, the θ and α angles characterizing the translational and rotational axes were clustered. A linear regression for each regional output variable (three variables in four ROIs) was performed based on the 100 impact simulation results from each head FE model. An additional linear regression was performed using νrot as the single independent variable, and their performances were compared in terms of coefficients of determination (R2). Finally, Pearson correlation was performed between the two FE models to assess the similarity in their responses relative to head impacts.
2.3 Relative contributions of alin and arot to regional brain strain-related responses
To further quantify the relative contributions of each acceleration component, two additional simulations were performed for each impact condition using either alin or arot only while setting the other acceleration component to zero. For each impact condition, accumulated peak responses from alin- or arot-only (i.e., and for εp obtained from alin- or arot-only, respectively; definitions for ε̇ and σ were analogous) were compared with and further normalized by their full-DOFs counterparts (i.e., ) for each element. Because the resulting normalized, element-wise differences constituted a spatial distribution, we reported the volume fractions above a range of percentage differences (thresh, varied from 0 to 100%) instead of a single value (e.g., volume-weighted average of the percentage differences) to characterize their response differences. Effectively, the reported volume fraction was analogous to an accumulated histogram at each threshold level. Volume fractions at each difference percentage level were obtained for all impact conditions to compute an average and a range for each regional response variable from the two FE models. To identify locations where large differences (e.g., >10%) were most likely to occur between responses from arot-only and full-DOFs, the qualifying elements were identified for each impact, and an accumulated score was obtained from all the impact simulations.
The normalized differences relative to the full-DOFs counterparts, however, did not necessarily reflect any clinical significance relative to mechanical thresholds that could potentially cause injury (e.g., the relative difference could be large in percentage, but the absolute magnitude of difference may not be clinically relevant). Therefore, to further evaluate the clinical feasibility of estimating strain-related responses using arot-only, we also reported the response differences relative to injury-causing thresholds drawn from an in vivo animal study for ε (optimal threshold of 0.18; Bain and Meaney, 2000) and FE-based analyses of real-world injury cases for ε̇ and σ (48.5 s−1 and 8.4 kPa, respectively; Kleiven 2007). These threshold values are similar to reports in other studies (e.g., 0.19 for ε in the grey matter (Zhang et al., 2004), 0.21 (0.26) for ε in the corpus callosum (grey matter; Kleiven 2007), and 7.8 kPa for σ in the brainstem (Zhang et al., 2004)). Analogously, element-wise incidence frequencies of large differences relative to these injury-causing thresholds were also reported.
2.4 Data analysis
Computational simulations for DHIM and SIMon were conducted in Abaqus/Explicit (Version 6.12; Dassault Systèmes, France) and LS-DYNA (Livermore Software Technology Corp., Livermore, CA), respectively, on a multi-core Linux cluster (Intel Xeon X5560, 2.80 GHz, 126 GB memory). All data analyses were performed in MATLAB (R2013a; Mathworks, Natick, MA). Statistical significance was reached when the p-value was <0.05.
3. Results
Linear regression results are given in Table 2. For the majority of the brain, volume-weighted peak response averages significantly correlated to , or effectively, νrot, regardless of the FE model used, although the results were not consistent in the brainstem. None of the responses was significantly correlated to any linear acceleration component. The resulting R2 values ranged 0.841–0.957 for the whole-brain, cerebrum, and cerebellum, with slightly lower values for the brainstem (range 0.678–0.898). When using νrot as the single independent variable, all corresponding coefficients were significant and the resulting R2 values only slightly decreased (by 4.6±5.1% on average and range 0.3–19.5%), especially for εp (by 1.8±2.7% on average and range 0.3–7.4%). Consistent and significant correlations existed between the two FE models for all regional responses (majority of the Pearson correlation coefficients were above 0.8 except for εp and ε̇p in the brainstem; Table 2).
Table 2.
Summary of linear regression coefficients using either all independent and interaction terms or νrot-only for each regional output variable for the two FE models (bold when p<0.05). The corresponding R2 values are also reported, along with Pearson correlation coefficients (r) between estimates from the two FE models (p<0.0001 for all correlations tested). VW: volume-weighted; εp is dimensionless, units for ε̇p and σp are s−1 and kPa, respectively.
| ROIs | Predictor | Model | Intercept |
|
Δtrot |
|
Δtlin |
|
|
R2 | Intercept | νrot | R2 | r | ||||
|---|---|---|---|---|---|---|---|---|---|---|---|---|---|---|---|---|---|---|
| whole brain | VW εp | DHIM | 0.01 | 6.9e-6 | 0.002 | −2.0e-4 | −1.7e-3 | 1.6e-6 | 2.4e-5 | 0.927 | 0.02 | 2.3e-6 | 0.923 | 0.980 | ||||
| SIMon | 0.04 | −6.8e-7 | −7.7e-4 | −3.2e-4 | −2.5e-3 | 1.6e-6 | 3.1e-5 | 0.901 | 0.01 | 1.6e-6 | 0.898 | |||||||
| VW ε̇p | DHIM | 7.8 | 0.001 | −0.4 | −0.05 | −0.5 | 4.0e-4 | 5.4e-3 | 0.925 | 0.7 | 4.9e-4 | 0.893 | 0.984 | |||||
| SIMon | 9.5 | 7.6e-4 | −0.5 | −0.04 | −0.4 | 2.6e-4 | 4.1e-3 | 0.935 | 2.2 | 3.0e-4 | 0.888 | |||||||
| VW σp | DHIM | 0.99 | -3.0e-4 | -0.11 | −2.3e-3 | −0.044 | 6.0e-6 | 2.7e-4 | 0.872 | −0.60 | 4.1e-5 | 0.859 | 0.939 | |||||
| SIMon | 1.33 | −2.1e-5 | -0.07 | −7.7e-3 | −0.056 | 4.2e-5 | 8.3e-4 | 0.945 | 0.17 | 4.1e-5 | 0.927 | |||||||
| cerebrum | VW εp | DHIM | 0.01 | 6.4e-6 | 2.5e-3 | −2.1e-4 | −2e-3 | 1.8e-6 | 2.7e-5 | 0.899 | 0.02 | 2.4e-6 | 0.896 | 0.963 | ||||
| SIMon | 0.04 | 9.4e-7 | −7.6e-4 | −2.5e-4 | −1.7e-3 | 1.6e-6 | 2.2e-5 | 0.947 | 0.01 | 1.6e-6 | 0.942 | |||||||
| VW ε̇p | DHIM | 8.6 | 1.1e-3 | −0.49 | −0.06 | −0.6 | 4.6e-4 | 6.2e-3 | 0.895 | 0.1 | 5.3e-4 | 0.871 | 0.955 | |||||
| SIMon | 8.4 | 1.0e-3 | -0.5 | −0.04 | −0.3 | 2.5e-4 | 4.0e-3 | 0.960 | 2.3 | 3.2e-4 | 0.902 | |||||||
| VW σp | DHIM | 1.12 | -3.1e-4 | -0.12 | −2.2e-3 | −0.050 | 7.1e-5 | 2.8e-4 | 0.849 | −0.69 | 4.1e-5 | 0.834 | 0.922 | |||||
| SIMon | 8.49 | 3.2e-6 | -0.041 | −5.2e-3 | −0.035 | 3.1e-5 | 5.1e-4 | 0.958 | 0.14 | 3.0e-5 | 0.942 | |||||||
| cerebellum | VW εp | DHIM | 0.01 | 6.5e-6 | 4e-5 | −1.9e-4 | −3.7e-4 | 8.0e-7 | 1.2e-5 | 0.911 | 0.01 | 1.3e-6 | 0.869 | 0.845 | ||||
| SIMon | 0.05 | −1.7e-6 | −1.1e-3 | −3.7e-4 | −2.8e-3 | 1.5e-6 | 3.6e-9 | 0.868 | 9.0e-3 | 1.3e-6 | 0.864 | |||||||
| VW ε̇p | DHIM | 5.31 | 2.4e-3 | −0.31 | −0.03 | −0.07 | 8.1e-5 | 1.9e-3 | 0.841 | 4.0 | 2.5e-4 | 0.677 | 0.831 | |||||
| SIMon | 8.7 | 6.9e-4 | −0.4 | −0.02 | −0.4 | 2.0e-4 | 3.2e-3 | 0.922 | 2.3 | 2.5e-4 | 0.869 | |||||||
| VW σp | DHIM | 0.23 | 8.9e-6 | −0.019 | −2.5e-3 | −7.3e-3 | 1.0e-5 | 2.1e-4 | 0.863 | −0.039 | 1.3e-5 | 0.828 | 0.935 | |||||
| SIMon | 1.81 | 4.1e-5 | −0.092 | −0.011 | −0.069 | 5.0e-5 | 1.0e-3 | 0.932 | 0.32 | 5.2e-5 | 0.901 | |||||||
| brainstem | VW εp | DHIM | −0.05 | 2.4e-5 | 6.2e-3 | 6.1e-5 | 1e-3 | −1.6e-7 | −1.3e-5 | 0.721 | 0.03 | 1.9e-6 | 0.668 | 0.591 | ||||
| SIMon | 0.03 | −1.9e-7 | −2.3e-4 | −1.7e-4 | −1.6e-3 | -1.2e-6 | −2.5e-5 | 0.824 | 0.01 | 1.2e-6 | 0.821 | |||||||
| VW ε̇p | DHIM | −7.9 | 5.7e-3 | 0.67 | 0.08 | 0.23 | −8.6e-5 | −6.4e-3 | 0.774 | 6.6 | 3.9e-4 | 0.635 | 0.687 | |||||
| SIMon | 6.7 | 4.2e-4 | −0.4 | −1.8e-3 | −0.3 | 2.0e-4 | 1.6e-3 | 0.898 | 2.1 | 2.2e-4 | 0.854 | |||||||
| VW σp | DHIM | −0.18 | −0.16e-3 | 0.013 | −4.7e-3 | −0.025 | 1.1e-5 | 3.1e-4 | 0.678 | −0.24 | 3.0e-5 | 0.648 | 0.860 | |||||
| SIMon | −0.26 | 3.0e-4 | 7.1e-3 | 3.5e-3 | 0.026 | 8.7e-6 | −0.26e-3 | 0.887 | 0.42 | 3.0e-5 | 0.79 |
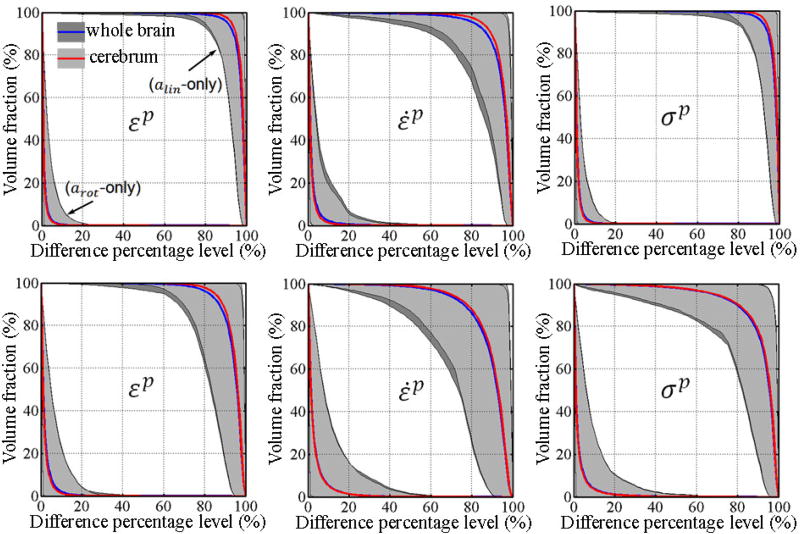
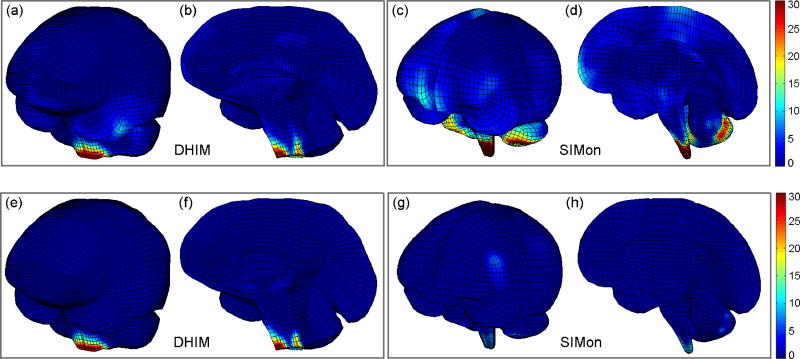
Using isolated responses from alin- or arot-only, volume fractions with response differences exceeding a range of percentage levels are shown in Fig. 3. Responses from alin-only were dramatically different from the full-DOFs counterparts for both models (e.g., more than 95% of the volume experienced differences greater than 80% relative to on average for the whole-brain and cerebrum). In contrast, the volume factions for arot-only virtually diminished (i.e., when the volume fraction became <1%) when the difference percentage level were above 10–20% on average for the whole-brain and cerebrum. The incidence frequency map clearly indicated that large differences (i.e., >10%) mostly occurred in the inferior region of the brain (i.e., brainstem for DHIM and brainstem and cerebellum for SIMon; Fig. 4a–d).
Figure 3.
Volume fractions for element-wise differences in εp, ε̇p, and σp generated from arot- and alin-only relative to their full-DOFs counterparts as a function of the difference percentage level for DHIM (top) and SIMon (bottom). To improve visualization, only results for the whole-brain and cerebrum are shown, which were nearly identical. Shaded areas indicate the ranges of differences from the 100 impacts simulated, while curves represent the average.
Figure 4.
Incidence frequency map in iso- (a, c, e, and g) and sagittal (b, d, f and h) views showing that element-wise large differences in εp between and (i.e., >10% relative to full-DOFs counterparts (top) or >5% relative to the optimal injury threshold of 0.18 (bottom)) occurred mostly in the brainstem for DHIM. Color indicates the number of incidences where element-wise large differences occurred from the 100 simulations. For SIMon, large differences mostly occurred in the brainstem and inferior region of the cerebellum when normalized by the full-DOFs counterparts (c and d), but the occurrence frequency was low when compared to the injury-causing threshold (g and h).
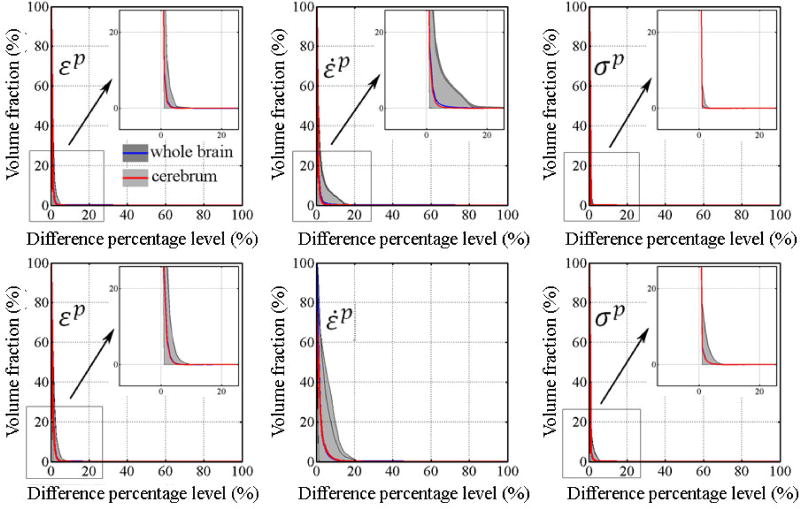
When the element-wise differences were normalized by injury-causing thresholds instead (Fig. 5), the volume fractions virtually diminished at a difference percentage level of 1–4% on average regardless of the response variable or FE model used, although a larger level of 10% was found for SIMon-estimated ε̇p. From all simulations, the largest difference levels when the volume fractions virtually diminished were 5%, 15%, and 2% (7%, 20%, and 6%) for εp, ε̇p and σp, respectively, for DHIM (SIMon). Similarly, large differences mostly occurred in the brainstem (a 5% instead of 10% difference percentage level was used here to improve visualization; Fig. 4e–h).
Figure 5.
Volume fractions for element-wise differences in εp, ε̇p, and σp generated from arot-only relative to injury-causing thresholds as a function of the difference percentage level for DHIM (top) and SIMon (bottom). Again, only results for the whole-brain and cerebrum are shown to improve visualization, and they were virtually identical.
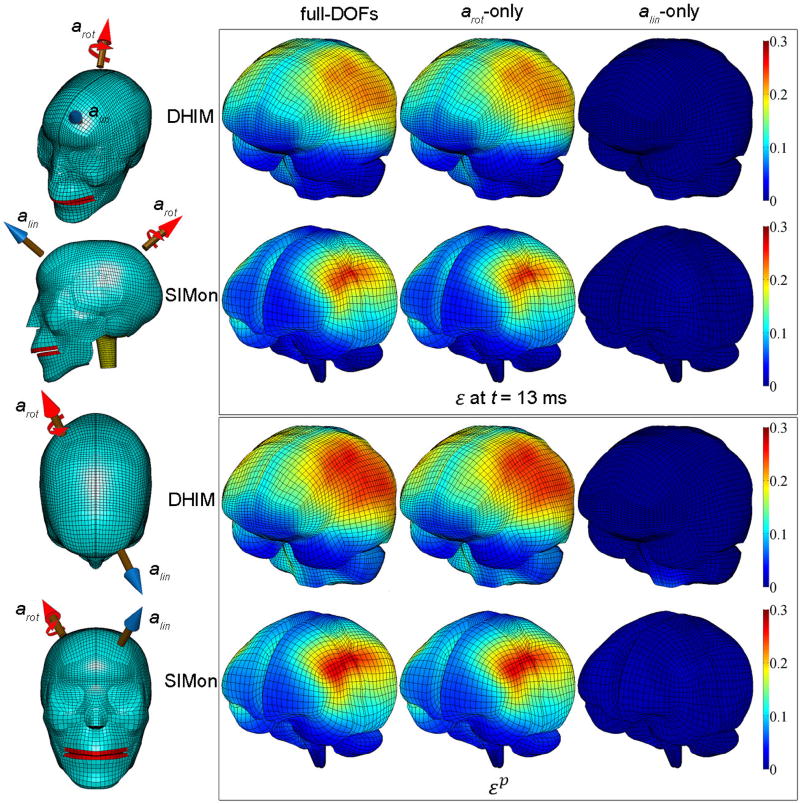
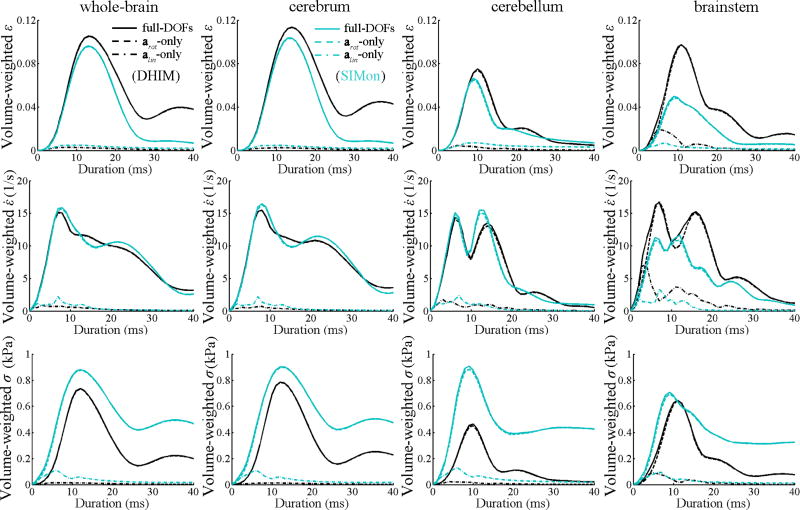
A representative impact condition was chosen (Fig. 2c) to visually compare the magnitude and distribution of instantaneous ε and accumulated εp generated from full-DOFs as well as from arot- and alin-only for the two FE models (Fig. 6). For each model, ε (when its average for the whole-brain reached its peak) and εp from arot-only were virtually identical to the full-DOFs counterparts. In contrast, the corresponding ε and εp from alin-only were negligible. The time histories of the average regional strain-related responses (spatially averaged at each time point) are shown in Fig. 7, which clearly indicated virtually identical magnitude and temporal trend between responses generated from arot-only and full-DOFs, with little responses from alin-only (except perhaps in the brainstem), regardless of the head FE model used.
Figure 6.
Left: The head impact condition selected for comparison of simulation results in four views. Top right panel: Comparison of ε generated from full-DOFs, arot-only, and alin-only for DHIM and SIMon at the instance when the whole-brain volume-weighted ε reached its peak (occurred at t=13 ms for both models). Bottom right panel: the corresponding , , and accumulated from the entire simulation. The spinal cord in DHIM was excluded for better comparison with the SIMon counterparts. Impact kinematic variable values are given in Fig. 2.
Figure 7.
Comparison of volume-weighted, time-varying, average responses of ε (top), ε̇ (middle), and σ (bottom) in the whole-brain, cerebrum, cerebellum, and brainstem obtained from DHIM (dark color) and SIMon (light color) using the same impact condition as in Fig. 6. For the whole-brain and cerebrum, responses from arot-only and full-DOFs were virtually identical. Arrow indicates an apparent secondary peak response of ε for DHIM, which was lacking or less evident for SIMon.
4. Discussion and Conclusion
Both linear (alin) and rotational (arot) accelerations contribute to head impact kinematics on the field in real-world contact sports. However, the two acceleration components are frequently isolated in injury studies. It is critical, therefore, to evaluate the feasibility of estimating brain responses using isolated instead of full DOFs kinematics for analysis of real-world injury. In this study, we investigated the sensitivities of regional brain strain-related responses to kinematic variables of alin and arot, and further quantified the relative contributions of these acceleration components to brain responses. Using a random sampling and linear regression technique with parameterized head impacts generated from on-field data relevant to contact sports, we found that volume-weighted regional averages of εp, ε̇p, and σp significantly correlated to arot, but not to alin, for both head FE models employed. While these findings agree well with previous reports (Zhang et al. 2004; Kleiven 2007; Takhounts et al., 2008; Ji et al., 2013a), our results further indicate that these strain-related responses significantly correlated to the product of the magnitude and duration of arot (instead of independently to either of them), or effectively, the rotational velocity, νrot, for the majority of the brain for both head FE models (Table 2). Because the resulting R2 values were typically high (mostly >0.85) and only slightly decreased when regressing with νrot–only for the majority of regional brain responses (e.g., by 1.8±2.7% for εp), our results suggest that it is feasible to correlate strain-related responses directly with νrot-only for practical applications. These findings based on simulated head impacts randomly and uniformly sampling the input parametric space were consistent with prior observations (Kleiven 2007; Yoganadan et al., 2008; Takhounts et al. 2008). From the perspective of dimensional analysis, such a finding may hardly be surprising because the converted brain strain energy due to deformation is likely proportional to the input rotational kinetic energy. Since the two energy terms are proportional to the square of strain and rotational velocity, respectively (Knudson, 2007), a linear relationship between strain and rotational velocity would incur. Regardless, because of the significant interaction between the peak magnitude and duration of arot, it is important to combine both kinematic variables instead of using peak magnitude of arot alone to evaluate regional brain strain levels, which is in concert with recent efforts of deriving kinematics-based metrics for assessing the risk of strain-induced injury (Takhounts et al., 2011; Kimpara and Iwamoto 2012).
More importantly, we have further quantified that alin, alone, generated little strain-related responses for the majority of the brain (Fig. 3). This finding confirms that HIC that only includes alin but not arot is likely irrelevant to strain-induced injury (correlation coefficients between the HIC values and the whole-brain insignificant for both DHIM and SIMon; p>0.9), albeit recognizing that on-field alin and arot measurements may be correlated while they were independently generated and thus, uncorrelated in this study. In contrast, arot, alone, produced the majority of responses compared to the full-DOFs counterparts especially for the DHIM as their volume fractions based on element-wise differences virtually diminished (i.e., when the volume fraction became less than 1%) at a difference percentage level of ~10%, 20%, and 10% for εp, ε̇p, and σp, respectively, on average (Fig. 3). Although larger element-wise relative differences existed for SIMon, much smaller differences were found when compared with injury-causing thresholds for both models (the volume fractions diminished at a difference percentage level of 1–4% for all of the three variables regardless of the model used, except for a larger level of ~10% for SIMon-estimated ε̇p; Fig. 5). This observation indicated that the element-wise absolute differences were mostly of low magnitudes. Most of the large differences occurred in the inferior region of the brain for both models, especially in the brainstem, although for SIMon, the occurrence frequency was much lower than DHIM when normalized by the injury-causing thresholds (Fig. 4). Such a consistent observation suggests that alin does influence brain strain-related responses in the inferior region, and that the differences between arot-only and full-DOFs are not likely to be related to the directionality of loading axes which were randomly generated in this study. The near-identical responses from arot-only relative to the full-DOFs counterparts were evident when comparing their instantaneous and accumulated spatial distributions (shown only for ε; Fig. 6) as well as regional averages over time (Fig. 7) for a selected case. These results suggest the feasibility of using isolated arot instead of full-DOFs to estimate regional strain levels and consequently, to assess the risk of strain-induced brain injury without significant loss of accuracy, especially for the cerebrum.
These finding were consistent for the two independently established and validated head FE models. The level of model-consistency in response trend relative to impact kinematics was high as the correlation coefficients between regional responses estimated from the two models were strong (e.g., ranged 0.922–0.963 for the cerebrum) and significant (p<0.0001; Table 2). Model-consistency in response trend was also apparent when comparing the regional average responses over time for one selected case (Fig. 7). However, model-dependency in response distribution (Fig. 6) and magnitude was also obvious because the DHIM-estimated peak value of ε (σ) was 9.7% (13.2%) higher (lower) than the SIMon counterpart for the cerebrum for the same case. Although the overall contributions of isolated alin were insignificant, the relative contributions seemed to be model dependent as well (e.g., higher for ε̇ in the brainstem for DHIM, while higher for σ in the cerebrum and cerebellum for SIMon which was negligible for DHIM; Fig. 7). Most of the large element-wise differences occurred in the brainstem (Fig. 7), where lower Pearson correlation coefficients were observed, especially for εp (Table 2). These model-dependencies were likely a result of differences in model features (e.g., details of how the brainstem region was modeled) and parameters (in particular, material properties of the brain; van Dommelen et al., 2010) as discussed recently (Ji et al., 2013a).
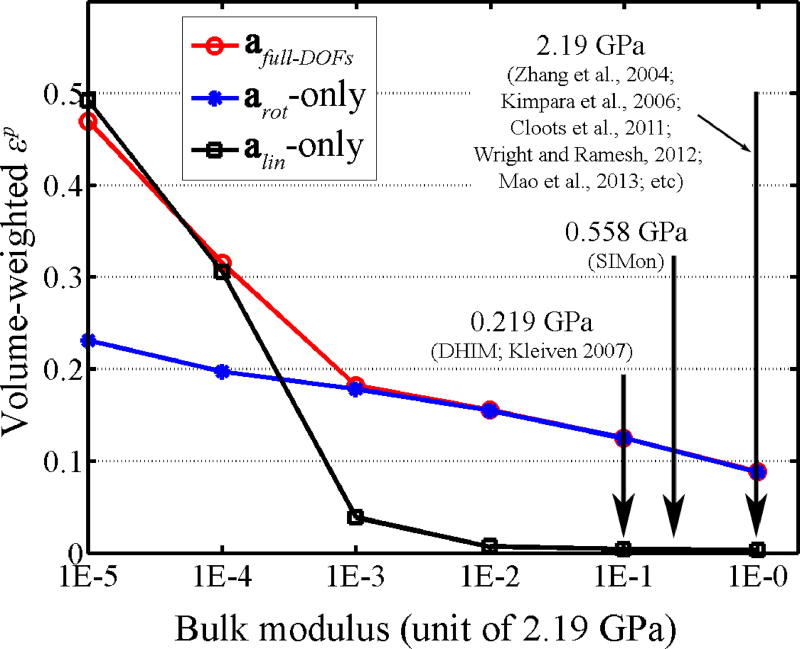
The ability to isolate strain-related responses from arot-only was likely a direct result of the brain’s (near) incompressibility due to its high water content (bulk modulus of the brain was 0.219 GPa and 0.558 GPa for DHIM and SIMon, respectively). When the brain is confined within a rigid skull with low or moderate alin (e.g., <100 g) applied, little volumetric change is possible to generate any significant strain. To verify this, we parametrically varied the brain’s bulk modulus in DHIM across 6-orders of magnitude and repeated the same impact simulations in Figs. 6 and 7 using arot-only, alin-only, and with full-DOFs. When the bulk modulus was above 0.0219 GPa, arot dominated the strain responses as was nearly identical to , with negligible (Fig. 8). With lower bulk modulus values, however, alin became increasingly dominant. Because most head FE models adopted for TBI studies employ an even higher bulk modulus for the brain (i.e., 2.19 GPa; Zhang et al., 2004; Kimpara et al., 2006; Cloots et al., 2011; Wright and Ramesh 2012; Mao et al., 2013; etc.), we anticipate similar findings likely to occur when a different head FE model is employed (e.g., the first version of SIMon (Takhounts et al., 2003) employed in Zhang et al, 2006, and the model in Kleiven 2006).
Figure 8.
Comparison of , , and for the whole-brain when the brain’s bulk modulus was varied across 6 orders of magnitude based on DHIM. Typical bulk modulus values from some representative studies are shown.
Our finding that isolated alin generated negligible strain for the majority of the brain agreed well with the report of <2% of ε in four individual elements from alin-only based on one lateral impact (Zhang et al., 2006). Similarly, Kleiven 2006 also reported up to 1.5–3% of ε in the fringe plots when the head was subjected to alin-only in three major axes, which was confirmed by repeating the same simulation ( of 80 g and Δtlin of 5 ms) using both DHIM and SIMon in our study. However, these results were in sharp contrast to that in Post et al. 2012 who reported ε values induced by alin-only (up to 13.6%) comparable to or often larger than that generated from arot-only. The seemingly contradictory finding was likely, in part, because of a different strain measure used in their study. Instead of using a volume-weighted regional average to characterize the response for a specific ROI, the maximum ε value regardless of the location or the time of occurrence from a single individual element (εm) was used in Post et al., 2012, which was analogous to that employed in the Wayne State University Head Injury Model (although an average value together with five neighboring elements was used in the latter; Ji et al., 2013a). Because a single maximum value from an individual element could be sensitive to mesh quality, a volume-weighted, accumulated peak response may be more representative of a regional response for a given ROI. Regardless, by repeating a selected simulation with alin-only ( , Δtlin=5 ms; identical to curve B along the x-axis in Post et al., 2012), we found that volume-weighted εp responses continued to be negligible (<1.2%) using either DHIM or SIMon. By comparison, DHIM reported εm values of 2.6% and 1.8% in the grey and white matter, respectively, while SIMon reported a εm value of 4.8% in the cerebrum (no grey/white matter differentiation in SIMon). However, these values were still much lower than the reported values of 13.6% and 13.1% in the grey and white matter, respectively, in Post et al., 2012. These comparisons suggest further significant differences exist between the head FE model used in Post et al., 2012 and DHIM/SIMon (e.g., possibly material properties of the brain and/or mesh resolution, etc.). Nevertheless, in addition to differences in head FE model features and parameters, it is important for researchers to recognize inconsistencies in response measures as well when comparing simulation results among different studies in the future in order to facilitate the exchange of model estimation results.
There are other important considerations to note regarding our results. Because the head impact conditions used in this study were constrained within the ranges relevant to contact sports and did not necessarily encompass the full spectrum of head impacts, it is important not to extend the applicability of our findings to higher levels of impact severities without further investigation (although repeating a simulation in Post et al., 2012 with of 150 g still yielded the same finding). However, since the head impact conditions generated in this study are rather general and not necessarily limited to sports-related head impacts, we anticipate that similar results and conclusions would also apply to other mild traumatic brain injury scenarios (e.g., traffic accidents) as long as the acceleration levels are in the same mild range as evaluated in this study. On the other hand, because we have employed parameterized instead of actual on-field head impacts as model inputs, we were able to simplify impact kinematics and to identify those variables important to brain responses. However, further investigation is necessary to verify whether our findings based on triangulated impulses can be extended to other types of rotational impulses. The random sampling technique also enabled us to statistically probe the head FE model input-output relationship without a brute-force enumeration in impact conditions (Weaver et al., 2012; Ji et al., 2013a) that could lead to a high dimensional input matrix and consequently, potentially excessive amount of computations. The statistical power with the 100 random sampling seemed sufficiently high, as similar results were obtained by halving the number of samplings. Because the kinematic variables were generated randomly and independently with no restriction imposed on the directionality of alin and arot, the resulting head kinematics may contain “inadmissible” head impacts not likely to occur in the real world (e.g., both translation along and rotation about the vertical axis). Further, the uniform distributions of the head impact kinematic variables did not reflect the distribution of on-field measurements which is typically skewed in peak magnitude (Rowson et al., 2009, Broglio et al., 2010; Broglio et al., 2012; Breedlove et al., 2012) and asymmetric in impact location (Breedlove 2012).
Another important limitation with our study is that we have simplified the head impacts into monophasic acceleration impulses but did not consider deceleration that would always occur in the real world (otherwise an unbounded head motion would incur, which is non-physical). A recent parametric study using a 2D FE model (Yoga et al., 2008) suggests up to 50% reduction in strain when the acceleration was immediately followed by a deceleration phase, and the differences diminished when the interval between the two phases were above 25 ms. These results indicate that brain responses could be sensitive to secondary acceleration/deceleration peaks as well. For the one selected case in this study, a secondary peak response of ε in the cerebrum was present with DHIM (around 38 ms; see arrow in Fig. 7), but was lacking or less evident with SIMon (although both models predicted a secondary peak response of σ in the same region). Such response differences in time may indicate that the significance of the deceleration phase could be model-dependent (likely due to the disparity in the material properties of the brain). Because of the observed reduction in strain, the single monophasic acceleration pulse likely provided an upper bound of regional brain strain responses, which could have an important implication when assessing the risk of strain-induced concussion. Regardless, further investigation using a realistic, validated 3D (as opposed to 2D) head FE model is warranted to study the sensitivity of regional brain responses to arot pulse shapes in order to evaluate whether the response level can be solely characterized by a single major peak of arot.
Finally, we have only evaluated regional strain-related responses but not pressure response in this study because the validation results for DHIM against pressure measurements from cadaveric head impacts (Nahum et al., 1997; Trossellie et al., 1992) are not available yet. As indicated in previous studies (Zhang et al. 2004; Kleiven 2007; Takhounts et al., 2008; Ji et al., 2013a), brain pressure response is likely dominated by alin. However, a quantitative investigation on the sensitivity of pressure to resultant alin and arot is necessary to elucidate the relative contributions of these acceleration components in order to assess whether pressure can be estimated from isolated alin alone without significant loss of accuracy, similarly to the strain-related responses evaluated in this study. These systematic studies to quantify the relative contributions of alin and arot to regional brain responses are critical to permit response estimation using reduced instead of full DOFs of head impact kinematics without significant loss of accuracy. They would establish a solid and much-needed foundation to establish a pre-computed model response atlas or a look-up-table that could allow impact simulation via an efficient “interpolation” (within seconds) instead of a direct simulation (typically requires hours of computational cost on a modern multi-core computer or even a super computer), which is only feasible with a substantial reduction in the dimensionality of input parametric space. If successful, such a pre-computation strategy could dramatically improve the throughput in head impact simulation, thereby enabling a model-based study on the cumulative effects of repetitive head impacts (each athlete typically sustains hundreds of head impacts in a single play season) on the risk of sports-related concussion, which has drawn growing and considerable interest in the research community as well as the general public alike. These investigations will be the subjects of future publications.
To conclude, using a random sampling technique with linear regression, we found that regional brain strain-related responses significantly correlated to the product of the magnitude and duration of the rotational acceleration component (instead of independently to either variable), or effectively, the rotational velocity, but not to linear acceleration. These findings suggest that it is necessary to incorporate both rotational impact magnitude and duration into kinematics-based metrics to assess regional brain strain levels and consequently, the risk of strain-induced injury. In addition, the strain-related responses estimated from arot-only were comparable to the full-DOFs counterparts for the majority of the brain especially when normalized by injury-causing thresholds derived from real-world injury studies (volume fractions virtually diminished (i.e., <1%) at typical difference percentage levels of 1–4% on average), suggesting the feasibility of using strain-related responses from isolated arot for analysis of strain-induced injury in contact sports without significant loss of accuracy, especially for the cerebrum. These findings consistently found from two independently established and validated head FE models may provide important new insights on the biomechanical basis of sports-related concussion to permit establishment of a pre-computed model response atlas that could substantially improve the throughput in head impact simulation.
Acknowledgments
This work was sponsored, in part, by the NIH grant R21 NS078607. The authors would like to thank Dr. Keith D. Paulsen from Thayer School of Engineering, Dartmouth College, Hanover, NH, USA, and Dr. Richard M. Greenwald, Mr. Jonathan G. Beckwith, and Dr. Richard P. Bolander from Simbex LLC, Lebanon, NH, USA, for their helpful comments on this manuscript.
Appendix: Description of the Dartmouth Head Injury Model and its validation
Briefly, the Dartmouth Head Injury Model (DHIM) was created based on a template high-resolution T1-weighted MRI of an athlete clinically diagnosed with concussion whose head was positioned neutrally without tilting in MRI. The methodology of model creation was described in detail in (Zhao et al., 2012). All solid (surface) parts were represented by hexahedral (quadrilateral) elements. A reduced integration with hourglass control was used (hourglass energy typically 5–8% of internal energy), and all anatomical interfaces were modeled as sharing nodes (Takhounts et al., 2008). Because of the soft CSF layer between the brain surface and all of its surrounding structures (falx, tentorium, dura), interfacial sliding of the brain was possible. The material properties of the brain were identical to the “average model” in Kleiven 2007, and were reported in (Ji et al., 2013b) along with the material properties for other components. In total, the model contains 101420 nodes and 115228 elements with a combined mass of 4.562 kg for the head, and 56632 nodes and 55062 elements with a combined mass of 1.436 kg for the brain.
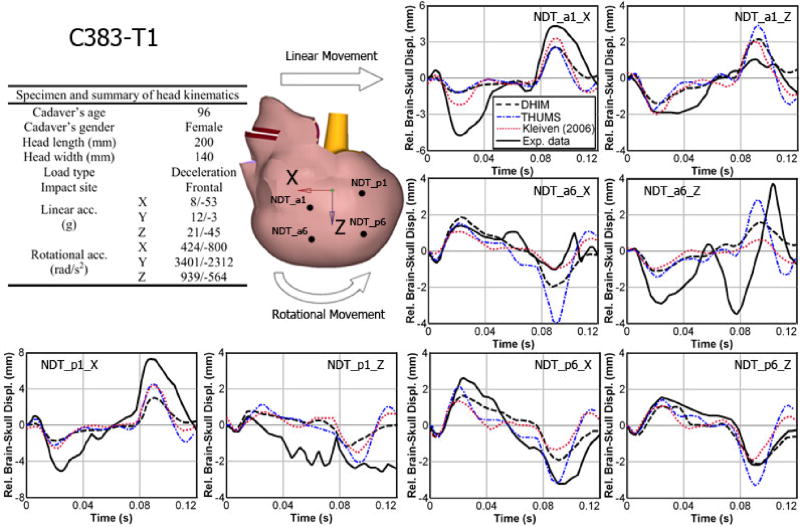
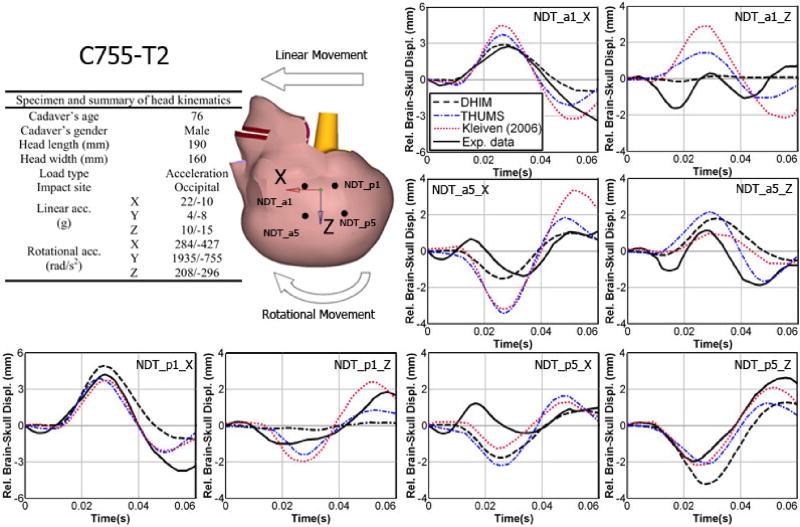
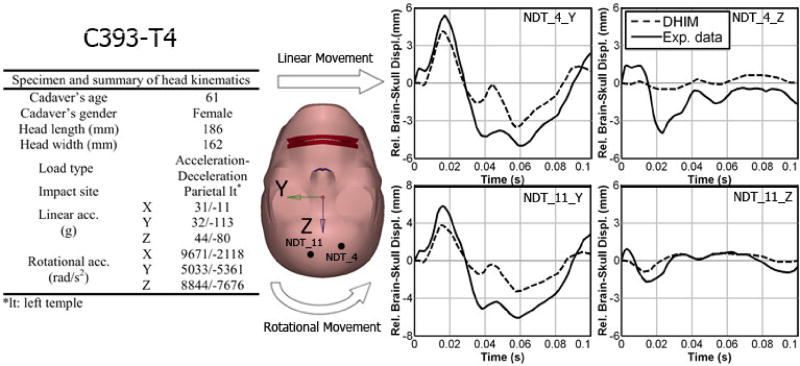
The DHIM was validated against brain-skull relative displacements measured in three representative cadaveric head impacts (frontal (C383-T1), occipital (C755-T2), and parietal (C394-T4); Hardy et al., 2001, 2007; model was scaled to match the reported cadaveric head dimension when possible). The performance was quantified in terms of correlation score (Kimpara et al., 2006) and correlation coefficient (Kleiven 2006). The average correlation score for DHIM was 83.37 (see Table A1), which was comparable to that of Total HUman Model for Safety (THUMS; average score of 85.52; Kimpara et al., 2006). Both models were categorized as “good” or nearly “excellent” according to a fidelity rating (de Lange et al., 2005). In addition, the validation performance of DHIM was also comparable to that in Kleiven 2006 in terms of average correlation coefficient (0.84 and 0.73 vs. 0.63 and 0.78 for the frontal and occipital impact, respectively). Comparison between model-estimated brain responses and the measurements are given in Figs. A1–A3 (results for the parietal impact only available for DHIM).
Table A1.
Summary of model validation performances of the DHIM and THUMS against brain-skull relative displacements measured from representative cadaveric head impacts in terms of correlation score in phase, amplitude, and shape (Kimpara et al., 2006).
| C383-T1 | CSN-phase | CSN-amp | CSN-shape | Average | ||||
|---|---|---|---|---|---|---|---|---|
|
| ||||||||
| DHIM | THUMS | DHIM | THUMS | DHIM | THUMS | DHIM | THUMS | |
| NDT_a1_x | 98.97 | 91.81 | 69.26 | 68.90 | 89.48 | 81.84 | 85.90 | 80.85 |
| NDT_a1_z | 76.55 | 94.40 | 99.37 | 99.96 | 53.35 | 65.88 | 76.42 | 86.75 |
| NDT_a6_x | 99.29 | 83.48 | 96.39 | 83.53 | 81.17 | 84.46 | 92.28 | 83.82 |
| NDT_a6_z | 82.27 | 69.32 | 77.86 | 91.58 | 69.03 | 60.58 | 76.39 | 73.83 |
| NDT_p1_x | 99.42 | 99.95 | 63.60 | 82.70 | 94.37 | 82.33 | 85.60 | 88.33 |
| NDT_p1_z | 99.61 | 88.67 | 84.56 | 91.41 | 37.13 | 47.26 | 73.77 | 75.78 |
| NDT_p6_x | 99.58 | 99.80 | 86.84 | 96.41 | 93.09 | 82.21 | 93.17 | 92.80 |
| NDT_p6_z | 99.40 | 99.68 | 99.43 | 97.96 | 91.09 | 82.73 | 96.64 | 93.46 |
|
| ||||||||
| C755-T2 | CSN-phase | CSN-amp | CSN-shape | Average | ||||
|
| ||||||||
| DHIM | THUMS | DHIM | THUMS | DHIM | THUMS | DHIM | THUMS | |
|
| ||||||||
| NDT_a1_x | 98.66 | 99.64 | 96.11 | 97.18 | 82.77 | 86.77 | 92.52 | 94.53 |
| NDT_a1_z | 99.04 | 0 | 51.03 | 99.25 | 59.22 | 89.75 | 69.77 | 63.00 |
| NDT_a5_x | 79.11 | 99.04 | 94.10 | 82.73 | 99.86 | 83.34 | 91.02 | 88.37 |
| NDT_a5_z | 87.26 | 96.51 | 99.67 | 99.23 | 29.51 | 68.89 | 72.15 | 88.21 |
| NDT_p1_x | 99.48 | 94.60 | 99.84 | 97.47 | 81.57 | 96.29 | 93.63 | 96.12 |
| NDT_p1_z | 97.25 | 97.37 | 44.58 | 99.14 | 79.49 | 80.47 | 73.77 | 92.33 |
| NDT_p5_x | 64.34 | 71.71 | 97.43 | 83.32 | 48.33 | 72.17 | 69.91 | 75.74 |
| NDT_p5_z | 92.27 | 99.60 | 99.68 | 97.15 | 79.87 | 86.50 | 90.61 | 94.42 |
|
| ||||||||
| C393-T4 | CSN-phase | CSN-amp | CSN-shape | Average | ||||
|
| ||||||||
| DHIM | THUMS | DHIM | THUMS | DHIM | THUMS | DHIM | THUMS | |
|
| ||||||||
| NDT_4_y | 99.06 | N/A | 87.86 | N/A | 92.41 | N/A | 93.11 | N/A |
| NDT_4_z | 99.88 | 83.90 | 28.12 | 70.63 | ||||
| NDT_11_y | 99.93 | 79.12 | 93.64 | 90.90 | ||||
| NDT_11_z | 95.45 | 88.81 | 74.88 | 86.38 | ||||
|
| ||||||||
| Average | 93.34 | 86.60 | 84.97 | 91.75 | 72.92 | 78.22 | 83.74 | 85.52 |
Fig. A1.
Comparison of model-estimated relative brain-skull displacements with those measured for selected neutral density target (NDT) locations (a1, a6, p1, and p6) in a frontal impact (C383-T1).
Fig. A2.
Comparison of model-estimated relative brain-skull displacements with those measured for selected NDT locations (a1, a5, p1, and p5) in an occipital impact (C755-T2).
Fig. A3.
Comparison of the DHIM-estimated relative brain-skull displacements with those measured for selected NDT locations (4 and 11) in a parietal impact (C394-T4).
References
- Centers for Disease Control and Prevention (CDC) Report to congress on mild traumatic brain injury in the United States: steps to prevent a serious public health problem. Atlanta, GA: National Center for injury Prevention and Control; 2003. pp. 1–45. [Google Scholar]
- Bain AC, Meaney DF, Hall H. Tissue-level thresholds for axonal damage in a nervous system white matter injury. J Biomech Eng. 2000;122:615–622. doi: 10.1115/1.1324667. [DOI] [PubMed] [Google Scholar]
- Beckwith JG, Greenwald RM, Chu JJ, Crisco JJ, Rowson S, Duma SM, Collins MW. Head impact exposure sustained by football players on days of diagnosed concussion. Med Sci Sports Exerc. 2013;45(4):737–746. doi: 10.1249/MSS.0b013e3182792ed7. [DOI] [PMC free article] [PubMed] [Google Scholar]
- Breedlove EL, Robinson M, Talavage TM, Morigaki KE, Yoruk U, O’Keefe K, Nauman EA. Biomechanical correlates of symptomatic and asymptomatic neurophysiological impairment in high school football. J Biomech. 2012;45(7):1265–1272. doi: 10.1016/j.jbiomech.2012.01.034. [DOI] [PubMed] [Google Scholar]
- Broglio SP, Schnebel B, Sosnoff JJ, Shin S, Fend X, He X, Zimmerman J. Biomechanical properties of concussions in high school football. Med Sci Sports Exerc. 2010;42(11):2064–2071. doi: 10.1249/MSS.0b013e3181dd9156. [DOI] [PMC free article] [PubMed] [Google Scholar]
- Broglio SP, Surma T, Ashton-Miller JA. High school and collegiate football athlete concussions: a biomechanical review. Ann Biomed Eng. 2012;40(1):37–46. doi: 10.1007/s10439-011-0396-0. [DOI] [PubMed] [Google Scholar]
- Cloots RJH, Nyberg T, Kleiven S, van Dommelen JAW, Geers MGD. Micromechanics of diffuse axonal injury: influence of axonal orientation and anisotropy. Biomech Model Mechanobiol. 2011;10:413–422. doi: 10.1007/s10237-010-0243-5. [DOI] [PubMed] [Google Scholar]
- Crisco JJ, Fiore R, Beckwith JG, Chu JJ, Brolinson PG, et al. Frequency and location of head impact exposures in individual collegiate football players. J Athl Train. 2010;45:549–559. doi: 10.4085/1062-6050-45.6.549. [DOI] [PMC free article] [PubMed] [Google Scholar]
- Daniel RW, Rowson S, Duma SM. Head impact exposure in youth football. Ann Biomed Eng. 2012;40(4):976–81. doi: 10.1007/s10439-012-0530-7. [DOI] [PMC free article] [PubMed] [Google Scholar]
- de Lange R, van Rooij L, Mooi H, Wismans J. Objective biofidelity rating of a numerical human occupant model in frontal to lateral impact. Stapp Car Crash J. 2005;49:457–79. doi: 10.4271/2005-22-0020. [DOI] [PubMed] [Google Scholar]
- Greenwald, Gwin JT, Chu JJ, Crisco JJ. Head impact severity measures for evaluating mild traumatic brain injury risk exposure. Neurosurgery. 2008;62(4):789–798. doi: 10.1227/01.neu.0000318162.67472.ad. [DOI] [PMC free article] [PubMed] [Google Scholar]
- Hardy WN, Foster CD, Mason MJ, Yang KH, King AI, Tashman S. Investigation of head injury mechanisms using neutral density technology and high-speed biplanar X-ray. Stapp Car Crash J. 2001;45:337–368. doi: 10.4271/2001-22-0016. [DOI] [PubMed] [Google Scholar]
- Hardy WN, Mason MJ, Foster CD, Shah CS, Kopacz JM, Yang KH, King AI, Bishop J, Bey M, Anderst W, Tashman S. A study of the response of the human cadaver head to impact; Proceedings of the 51st Stapp Car Crash Conf SAE paper 2007-22-0002; 2007. pp. 17–80. [DOI] [PMC free article] [PubMed] [Google Scholar]
- Ji S, Ghadyani H, Bolander RP, Beckwith JG, Ford JC, McAllister TW, Flashman LA, Paulsen KD, Ernstrom K, Jain S, Raman R, Zhang L, Greenwald RM. Parametric comparisons of intracranial mechanical responses from three validated finite element models of the human head. Ann Biomed Eng. 2013a;42(1):11–24. doi: 10.1007/s10439-013-0907-2. 2014. [DOI] [PMC free article] [PubMed] [Google Scholar]
- Ji S, Zhao W, Ford JC, Beckwith JG, Bolander RP, Greenwald RM, Flashman RA, Paulsen KD, McAllister TW. Group-wise evaluation and comparison of white matter fiber strain and maximum principal strain in sports-related concussion (under review and in revision) 2013b doi: 10.1089/neu.2013.3268. [DOI] [PMC free article] [PubMed] [Google Scholar]
- Kimpara H, Iwamoto M. Mild traumatic brain injury predictors based on angular accelerations during impacts. Ann Biomed Eng. 2012;40(1):114–26. doi: 10.1007/s10439-011-0414-2. [DOI] [PubMed] [Google Scholar]
- Kimpara H, Nakahira Y, Iwamoto M, Miki K, Ichihara K, Kawano S, Taguchi T. Investigation of anteroposterior head-neck responses during severe frontal impacts using a brain-spinal cord complex FE model. Stapp Car Crash J. 2006;50:509–44. doi: 10.4271/2006-22-0019. [DOI] [PubMed] [Google Scholar]
- King AI, Yang KH, Zhang L, Hardy W, Viano DC. Is head injury caused by linear or angular acceleration?; IRCOBI Conf; 2003. pp. 1–12. [Google Scholar]
- Kleiven S. Evaluation of head injury criteria using a finite element model validated against experiments on localized brain motion, intracerebral acceleration, and intracranial pressure. Int J Crashworthiness. 2006;11(1):65–79. doi: 10.1533/ijcr.2005.0384. [DOI] [Google Scholar]
- Kleiven S. Predictors for Traumatic Brain Injuries Evaluated through Accident Reconstructions. Stapp Car Crash J. 2007;51:81–114. doi: 10.4271/2007-22-0003. [DOI] [PubMed] [Google Scholar]
- Knudson D. Fundamentals of Biomechanics. Springer; 2007. [Google Scholar]
- Mao H, Zhang L, Jiang B, Genthikatti VV, Jin X, Zhu F, Makwana M, Gill A, Jandir G, Singh A, Yang KH. Development of a finite element human head model partially validated with thirty five experimental cases. J Biomech Eng. 2013;135(11):111002–111015. doi: 10.1115/1.4025101. [DOI] [PubMed] [Google Scholar]
- Marjoux D, Baumgartner D, Deck C, Willinger R. Head injury prediction capability of the HIC, HIP, SIMon and ULP criteria. Accid Anal Prev. 2008;40:1135–1148. doi: 10.1016/j.aap.2007.12.006. [DOI] [PubMed] [Google Scholar]
- McAllister TW, Ford JC, Ji S, Beckwith JG, Flashman LA, Paulsen KD, Greenwald RM. Maximum principal strain and strain rate associated with concussion diagnosis correlates with changes in corpus callosum white matter indices. Ann Biomed Eng. 2011;40(1):127–40. doi: 10.1007/s10439-011-0402-6. [DOI] [PMC free article] [PubMed] [Google Scholar]
- Morrison B, III, Cullen DK, Laplaca M. In vitro models for biomechanical studies of neural tissues. 2011;3:247–285. doi: 10.1007/8415. [DOI] [Google Scholar]
- Nahum AM, Smith R, Ward CC. Proc. 21st Stapp Car Crash Conf: SAE Paper No. 770922. SAE; Warrendale, PA: 1977. Intracranial pressure dynamics during head impact. [Google Scholar]
- Newman JA. A generalized acceleration model for brain injury threshold (GAMBIT). Int IRCOBI Conf; Zurich, Switzerland. 1986. pp. 121–131. [Google Scholar]
- Newman JA, Shewchenko N, Welbourne E. A proposed new biomechanical head injury assessment function – the maximum power index; 44th Stapp Car Crash Conf, Atlanta, GA, USA, SAE paper 2000-01-SC16.D; 2000. [DOI] [PubMed] [Google Scholar]
- Hamby M. A review of techniques for parameter sensitivity analysis of environmental models. Environ Monit Assess. 1994;32(2):135–154. doi: 10.1007/BF00547132. [DOI] [PubMed] [Google Scholar]
- Pellman EJ, Viano DC, Tucker AM, Casson IR, Waeckerle JF. Concussion in professional football: reconstruction of game impacts and injuries. Neurosurgery. 2003;53(4):799–814. doi: 10.1227/01.NEU.0000083559.68424.3F. [DOI] [PubMed] [Google Scholar]
- Post A, Hoshizaki B, Gilchrist MD. Finite element analysis of the effect of loading curve shape on brain injury predictors. J of biomech. 2012;45(4):679–83. doi: 10.1016/j.jbiomech.2011.12.005. [DOI] [PubMed] [Google Scholar]
- Rowson S, Brolinson G, Goforth M, Dietter D, Duma S. Linear and angular head acceleration measurements in collegiate football. J biomech Eng. 2009;131(6):061016. doi: 10.1115/1.3130454. [DOI] [PubMed] [Google Scholar]
- Rowson S, Duma SM, Beckwith JG, Chu JJ, Greenwald RM, Crisco JJ, Maerlender AC. Rotational head kinematics in football impacts: an injury risk function for concussion. Ann Biomed Eng. 2012;40(1):1–13. doi: 10.1007/s10439-011-0392-4. [DOI] [PMC free article] [PubMed] [Google Scholar]
- Rowson S, Duma SM. Brain injury prediction: assessing the combined probability of concussion using linear and rotational head acceleration. Ann Biomed Eng. 2013;41(5):873–882. doi: 10.1007/s10439-012-0731-0. [DOI] [PMC free article] [PubMed] [Google Scholar]
- Takhounts EG, Ridella SA, Hasija V, Tannous RE, Campbell JQ, Malone D, Danelson K, Stitzel J, Rowson S, Duma S. Investigation of traumatic brain injuries using the next generation of simulated injury monitor (SIMon) finite element head model. Stapp Car Crash J. 2008;52:1–31. doi: 10.4271/2008-22-0001. [DOI] [PubMed] [Google Scholar]
- Takhounts EG, Eppinger R, Campbell JQ, Tannous R, Power E, Shook L. On the development of the SIMon finite element head model. Stapp Ccar Crash Journal. 2003;47:107–133. doi: 10.4271/2003-22-0007. [DOI] [PubMed] [Google Scholar]
- Takhounts EG, Hasija V, Ridella SA, Rowson S, Duma SM. Kinematic rotational brain injury criterion (BRIC); The 22nd International Technical Conference on the Enhanced Safety of Vehicles (ESV), Paper No. 11-0263, 2011.2001. [Google Scholar]
- Trosseille X, Tarriere C, Lavaste F. Development of a F.E.M. of the human head according to a specific test protocol; Proc. 36th Stapp Car Crash Conf, SAE Paper No. 922527.1992. [Google Scholar]
- van Dommelen JAW, van der Sande TPW, Hrapko M, Peters GWM. Mechanical properties of brain tissue by indentation: interregional variation. J Mech Behav Biomed Mater. 2010;3:158–166. doi: 10.1016/j.jmbbm.2009.09.001. [DOI] [PubMed] [Google Scholar]
- Weaver AA, Danelson KA, Stitzel JD. Modeling brain injury response for rotational velocities of varying directions and magnitudes. Ann Biomed Eng. 2012;40(9):2005–2018. doi: 10.1007/s10439-012-0553-0. [DOI] [PubMed] [Google Scholar]
- Willinger R, Baumgartner D. Numerical and physical modelling of the human head under impact – towards new injury criteria. Int J Vehicle Design. 2003;32:94–115. [Google Scholar]
- Wright RM, Ramesh KT. An axonal strain injury criterion for traumatic brain injury. Biomech Model Mechanobiol. 2012;11:245–260. doi: 10.1007/s10237-011-0307-1. [DOI] [PubMed] [Google Scholar]
- Yang KH, Mao H, Wagner C, Zhu F, Chou CC, King AI. Studies in Mechanobiology, Tissue Engineering and Biomaterials. Springer-Verlag; Berlin Heidelberg: 2011. Modeling of the brain for injury prevention; pp. 69–120. Retrieved from http://www.springerlink.com/index/U7368378332M5820.pdf. [Google Scholar]
- Yoganandan N, Li J, Zhang J, Pintar FA, Gennarelli TA. Influence of angular acceleration-deceleration pulse shapes on regional brain strains. J biomech. 2008;41(10):2253–2262. doi: 10.1016/j.jbiomech.2008.04.019. [DOI] [PubMed] [Google Scholar]
- Zhang L, Yang KH, King AI. A proposed injury threshold for mild traumatic brain injury. J Biomech Eng. 2004;126:226–36. doi: 10.1115/1.1691446. [DOI] [PubMed] [Google Scholar]
- Zhang J, Yoganandan N, Pintar FA, Gennarelli TA. Role of translational and rotational accelerations on brain strain in lateral head impact. Biomed Sci Instrum. 2006;42:501–6. [PubMed] [Google Scholar]
- Zhao W, Ruan SJ, Li H, Cui S, He L, Li J. Development and validation of a 5th percentile human head finite element model based on the Chinese population. Int J Vehicle Safety. 2012;6(2):91–109. [Google Scholar]


