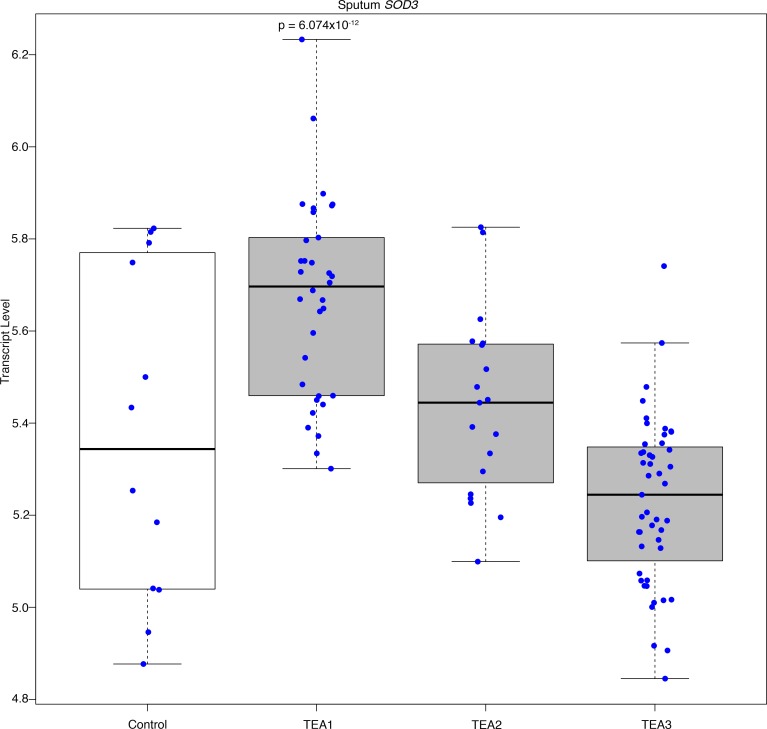
Figure 1. Sputum SOD3 transcript increases with asthma severity.
Sputum samples were collected from the Yale Center for Asthma and Airway Diseases (YCAAD) cohort consisting of asthmatic patients (n = 112) that were divided into 3 groups based on transcriptomic endotypes of asthma (TEA) as described in (32). TEA1 (n = 34) is the most severe endotype followed by TEA2 (n = 19) and TEA3 (n = 47). CTRL (n = 12) is the non-atopic healthy control. Graph shows distribution of each individual represented by a dot in respective groups. RNA sequencing was performed to find that the SOD3 transcript was highest in the TEA1 cluster (P = 6.0737 × 10⁻¹²) and decreased with asthma severity to control levels in TEA3. The y axis represents the transcript level. Bottom and top of the boxes are the 25th and 75th percentile and the band near the middle of the box is the 50th percentile (the median).

