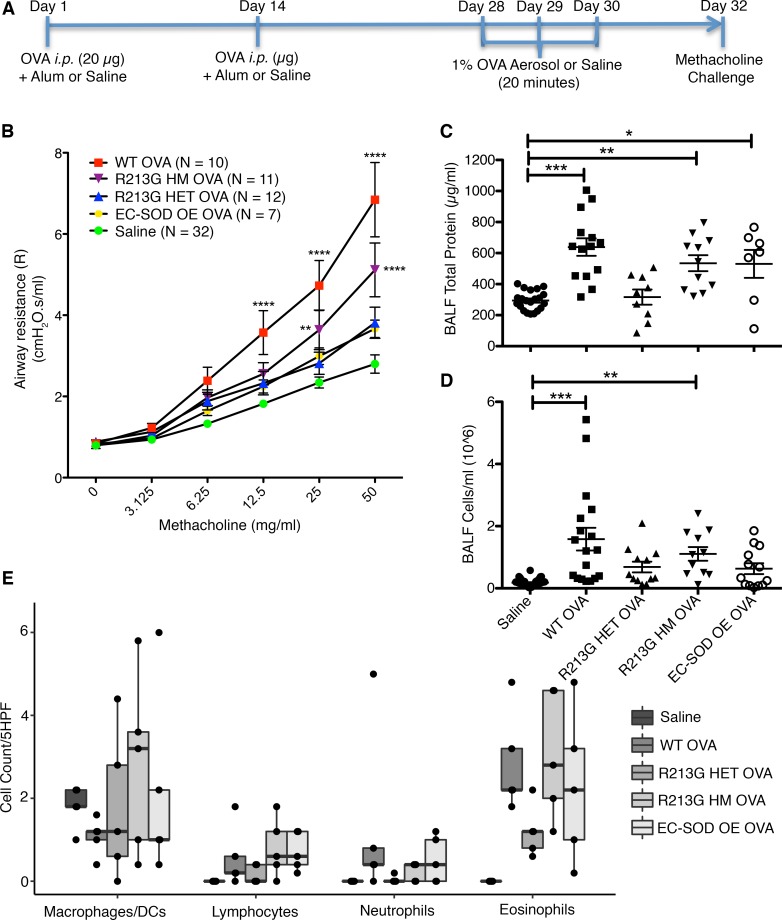
Figure 3. R213G protects mice from airway hyperresponsiveness and inflammatory cell infiltration.
(A) C57BL/6 WT, R213G HET, R213G HM, and EC-SOD OE mice were sensitized and challenged with ovalbumin or saline as indicated in Figure 2A. Saline control contained all the genotypes that were included in OVA. (B) On day 32, methacholine challenge was performed on FlexiVent to measure airway resistance (R) with doses ranging from 0 to 50 mg/ml in saline. Two-way ANOVA was used with Bonferroni multiple comparisons. (C) Total protein was measured in BALF to estimate protein leakage into the airway lumen (Saline = 21, WT OVA = 14, R213G HET OVA = 9, R213G HM OVA = 11, EC-SOD OE OVA = 7). One-way ANOVA was used with Tukey’s multiple comparison test. (D) Inflammatory cell infiltration was measured as total cell count in the BALF (Saline = 47, WT OVA = 18, R213G HET OVA = 12, R213G HM OVA = 11, EC-SOD OE OVA = 13). One-way ANOVA was used with Tukey’s multiple comparison test. (E) Cytospin slides (n = 5/group), stained with H&E were manually counted to identify cell types/5 high-power fields (5HPF). Investigators were blinded to the sample group allocation for cell counts. Bottom and top of the boxes are the 25th and 75th percentile and the band near the middle of the box is the 50th percentile (the median). Two-way ANOVA was used with Bonferroni multiple comparisons. Error bars represent ± SEM. *P < 0.05, **P < 0.01, ***P < 0.001, ****P < 0.0001.

