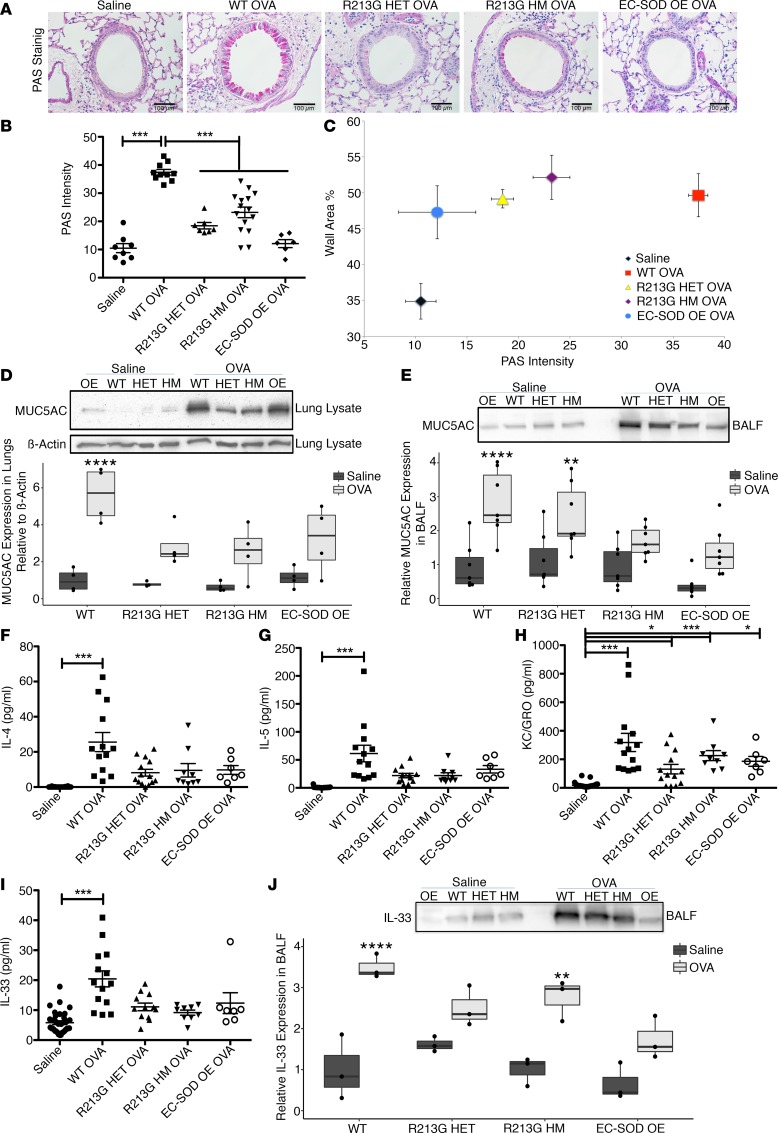
Figure 4. R213G reduces mucus hyperproduction and secretion in OVA-exposed mice.
(A) Images (magnification, ×20) of left lung stained with PAS showing effect of OVA on different genotypes. Scale bars: 100 μm. (B) Graph shows PAS intensity in the airway epithelium, measured by FIJI software. One-way ANOVA was used with Tukey’s multiple comparison test (Saline = 8, WT OVA = 10, R213G HET = 7, R213G HM = 15, EC-SOD OE = 7). PAS intensity was also plotted against wall area percentage in Figure 4C. Mucus hyperproduction and secretion were measured with MUC5AC densitometric analysis of the Western blots in lung lysate (D) and BALF (E), n = 4–7/group. An equal volume of BALF was loaded in each well to control for variations in Western blots. Equal volumes of BALF samples were run on MSD and plotted against the standard curves to obtain concentrations of IL-4 (F), IL-5 (G), KC/GRO (H), and IL-33 (I) in pg/ml. One-way ANOVA was used with Tukey’s multiple comparison test. Saline = 32, WT OVA = 14, R213G HET OVA = 13, R213G HM OVA = 9, EC-SOD OE OVA = 7. (J) Representative of 3 samples/group and densitometric analysis of volume-controlled BALF. Bottom and top of the boxes are the 25th and 75th percentile and the band near the middle of box is the 50th percentile (the median). Analysis was done by 2-way ANOVA with Bonferroni multiple comparisons. Error bars represent ± SEM. *P < 0.05, **P < 0.01, ***P < 0.001, ****P < 0.0001.

