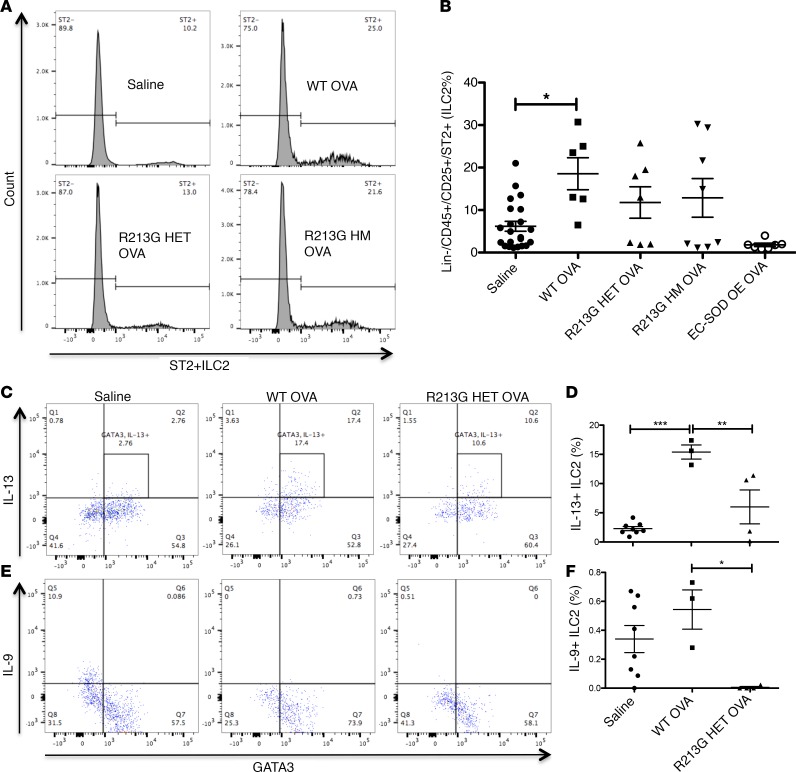
Figure 5. R213G reduces OVA-induced ILC2s in mouse lungs.
(A) Histogram showing ILC2 (Lin−, CD45+, CD25+, ST2+) differences among saline (n = 22), WT OVA (n = 6), R213G HET OVA (n = 7), R213G HM OVA (n = 8), and EC-SOD OE OVA (n = 7). ILC2% refers to the percentage of CD25+ cells that are ST2+. Analysis of ILC2% is shown in Figure 5B. One-way ANOVA was used with Tukey’s multiple comparison test. (C and D) IL-13+ ILC2s and (E and F) IL-9+ ILC2s in Saline (n = 8), WT OVA (n = 3), R213G HET OVA (n = 4). IL-13+ ILC2s were defined as Lin− (CD3, Ly-6G/Ly-6C, CD11b, CD45R/B220, TER-119), CD5−, CD49b−, TCRαβ−, TCRγδ−, CD45+, CD90+, ST2+, GATA+, and IL-13+, and IL9+ ILC2s were identified as Lin− (CD3, Ly-6G/Ly-6C, CD11b, CD45R/B220, TER-119), CD5−, CD49b−, TCRαβ−, TCRγδ−, CD45+, CD90+, ST2+, GATA+, and IL-9+. One-way ANOVA with Tukey’s multiple comparison test was used. Error bars represent ± SEM. *P < 0.05, **P < 0.01, ***P < 0.001.

