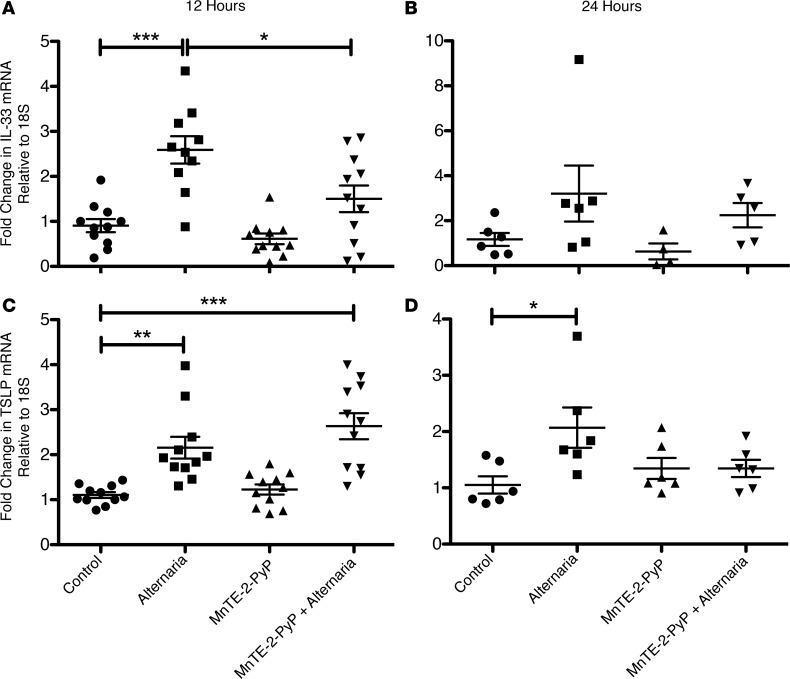
Figure 6. SOD mimetic decreases Alternaria-induced IL-33 and TSLP expression in BEAS-2B cells.
Dot plot showing fold-change in IL-33 mRNA after 12 hours (A) and 24 hours (B), and in TSLP mRNA after 12 hours (C) and 24 hours (D). n = 10/group in the 12-hour time point and 6/group in the 24-hour time point. Data were generated with 4 different BEAS-2B cell passages in 3 independent experiments for the 12-hour time point and 3 different cell passages in 3 independent experiments for the 24-hour time point. One-way ANOVA was used with Tukey’s multiple comparison test. Error bars represent ± SEM. *P < 0.05, **P < 0.01, ***P < 0.001.

