
Figure 3. PSGL-1 is upregulated in APS patient neutrophils.
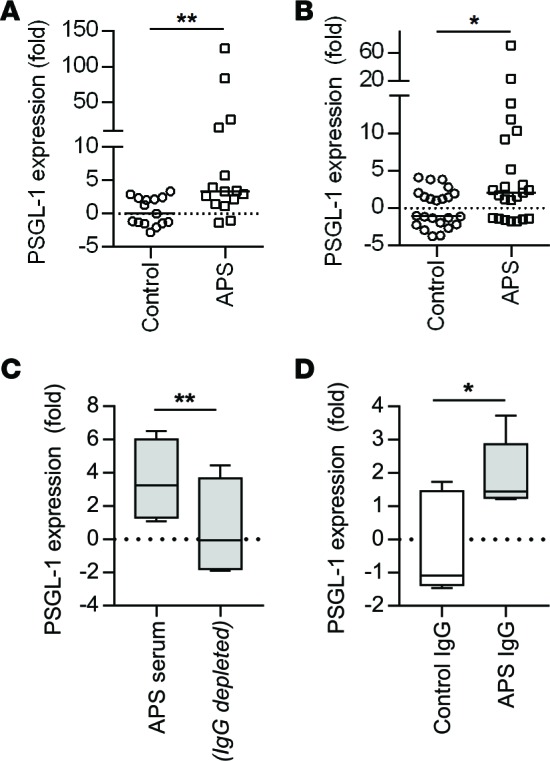
(A) RNA was prepared from patients with primary APS, none of whom were a part of the RNA-sequencing analysis. Expression of the gene encoding for PSGL-1 was determined by quantitative PCR, with normalization to the β-actin gene. The median for each group is denoted by a solid horizontal line, while each data point represents a unique control/patient; **P < 0.01 by Mann-Whitney test. (B) Neutrophils were isolated from healthy controls and then incubated with heterologous control serum or APS serum for 4 hours. RNA was prepared and subjected to quantitative PCR as in panel A. The median for each group is denoted by a solid horizontal line, while each data point represents stimulation with a unique control/patient serum sample; *P < 0.05 by Mann-Whitney test. (C) Control neutrophils were incubated with either APS serum (n = 5) or the same APS serum samples depleted of total IgG. After 4 hours, RNA was prepared and subjected to quantitative PCR. Box-and-whisker plots denote minimum, 25th percentile, median, 75th percentile, and maximum; **P < 0.01 by paired t test. (D) Control neutrophils were incubated with IgG purified from controls or APS patients (n = 5). After 4 hours, RNA was prepared and subjected to quantitative PCR. *P < 0.05 by two-tailed t test.