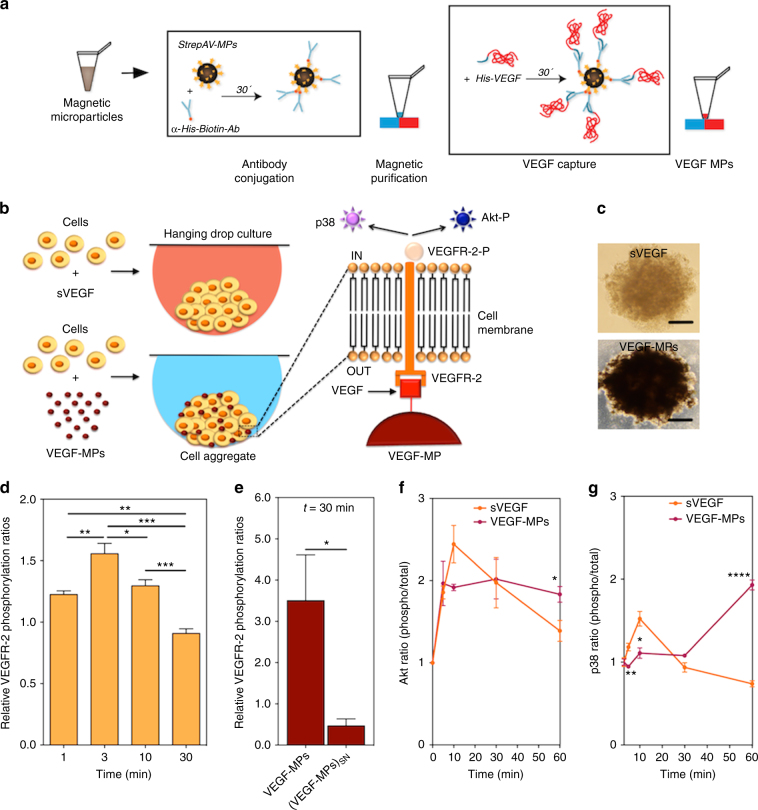
Fig. 1.
Preparation of VEGF-MPs and biological characterization in OEPCs. a Schematic representation of the protocol for the preparation of VEGF-conjugated particles and b for the formation of cell aggregates containing sVEGF or VEGF-MPs. c Light microscopy images of the OEPC aggregates at 24 h. The differences in color of cell aggregates are due to the presence of MPs. B ar corresponds to 50 μm. d VEGFR-2 phosphorylation in OEPC aggregates cultured in media containing sVEGF. e VEGFR-2 phosphorylation in OEPC aggregates containing VEGF-MPs or containing cell culture media exposed to the same number of MPs used to make the cell aggregates [(VEGF-MPs)SN]. VEGF phosphorylation was quantified by ELISA. Values are given as average ± SEM (n = 4–8). f, g ELISA quantification of phospho-Akt/total Akt (f) and phospho-p38/total p38 (g). Values are given as average ± SEM (n = 3). In d, statistical analyses were performed using one-way ANOVA followed by a Bonferroni post test. In e–g, unpaired t-test was performed between groups. *P ≤ 0.05, **P ≤ 0.01, ***P ≤ 0.001, and ****P ≤ 0.0001

