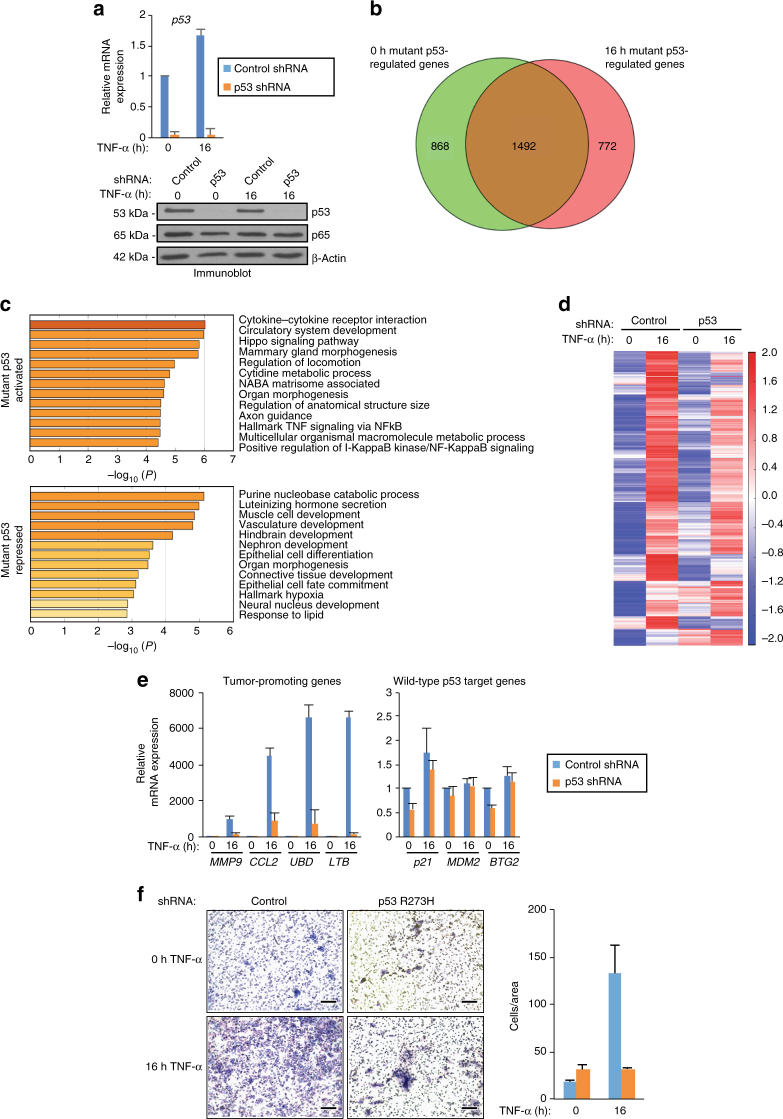
Fig. 1.
Mutp53 regulates chronic TNF-α induction of protumorgenic genes. a qRT-PCR (top) and immunoblot (bottom) analyses of SW480 cells induced to express LacZ (control) or p53 (p53) shRNA and treated with TNF-α for 0 or 16 h. The expression levels following TNF-α treatment are relative to the levels before TNF-α exposure. The bar graph represents the average of three independent experiments with the error bars denoting the standard error. b Venn diagram depicting the number of genes affected by mutp53 depletion in SW480 cells treated as described in (a). Genes were sorted prior to (green, 0 h) or after (pink, 16 h) TNF-α treatment (FDR < 0.05). c Gene Ontology analysis using Metascape of the 772 mutp53-regulated genes upon 16 h TNF-α treatment, corresponding to the pink only portion of the Venn diagram in (b). d Heat map of the differentially expressed RefSeq genes induced by twofold or higher (FDR < 0.05) after TNF-α induction in the control relative to the mutp53 knockdown cells. e qRT-PCR analyses of mutp53 target genes (left) and known wild-type p53 target genes (right) in control and p53 shRNA SW480 cells that were treated with TNF-α for 0 or 16 h. The expression levels shown after TNF-α are relative to the levels before treatment. The bar graph represents the average of three independent experiments with the error bars denoting the standard error. f Representative images (left) and quantitation (right) of invasion assays performed with SW480 cells treated as described in (a) that were fixed and detected by Giemsa staining (scale bar: 0.2 mm). The bar graph represents the average number of cells invaded through the Matrigel-coated membrane from three independent experiments with the error bars denoting the standard error

