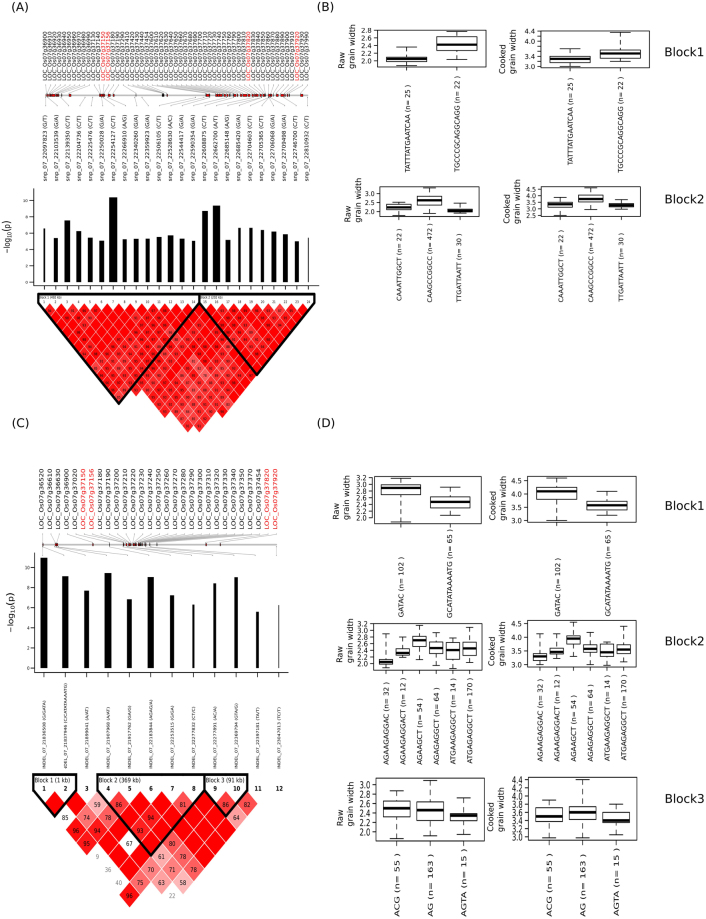
Figure 6.
GWAS for grain width (GWi) using SNPs and indels revealed the association of a region in chromosome 7 to GWi. (A) The linkage disequilibrium (LD) plot of the 24 tag SNPs significantly associated with grain width. A scaled and highly dense plot of the associated genomic region on the chromosome is shown where the relevant genes are marked in red (boxes). The positions of the 24 tagged SNPs are also marked with the log10-scaled association P values of these 24 SNPs are shown in the bar plot where black bars reflect their relative effect sizes. The gene IDs further detected in TGAS were highlighted in red color. (B) Haplotypes constructed based on SNPs in LD are represented as boxplot with the phenotype values for both normal and cooked grain explained by specific haplotype. Also shown are (C) the linkage disequilibrium plot for indels associations for the chromosome 7 with black bar graph signifies effect size on the grain width and (D) Haplotype constructed with phenotype distribution within each blocks formed from the significant indels in the region represented as boxplot for both cooked and raw grain.

