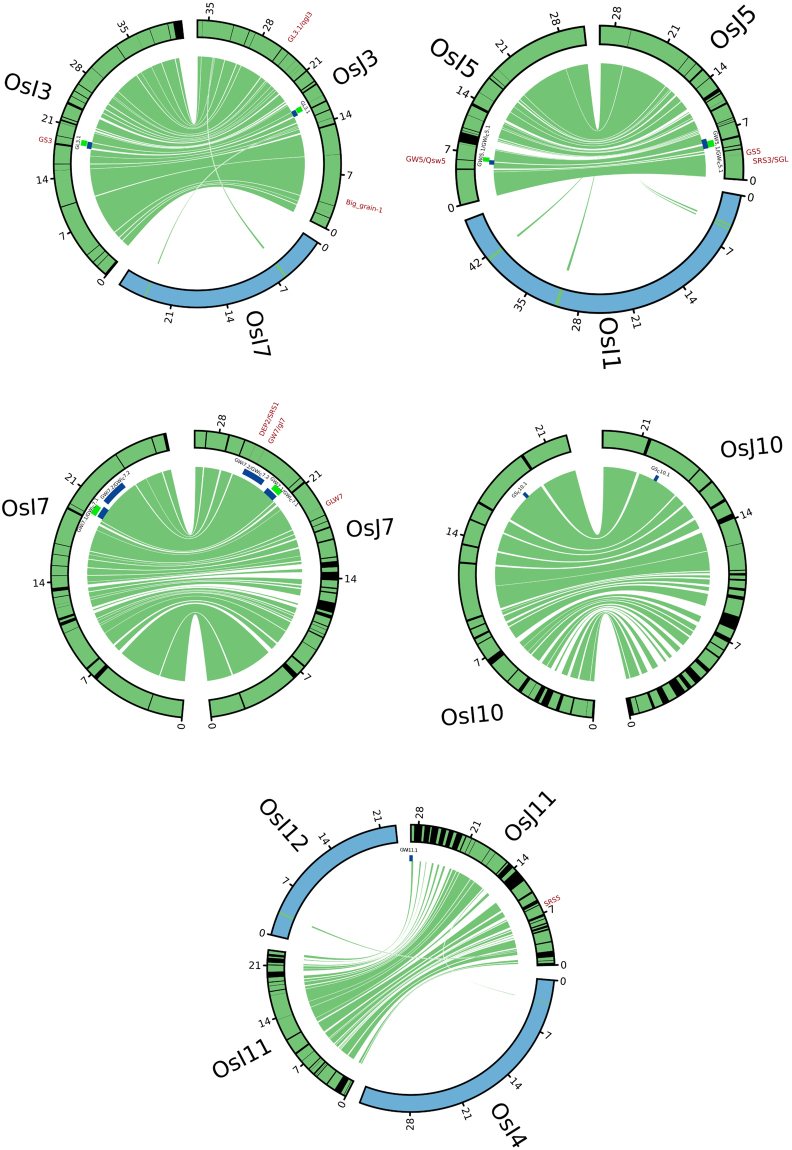
Figure 8.
Detailed sequence collinearity in chromosomes 3, 5, 7, 10 and 11 between indica and japonica reference genomes. Circos plots showed syntenic relationship of five chromosomes (physical size shown in Mb) within indica and japonica subspecies based on protein sequence alignment. Conserved regions were shown in green while black lines represented the break points. The positions of genes that have been cloned for grain width, length and shape were also labeled in the synteny map. Blue and green boxes represented regions in the respective chromosome where GWAS peaks were detected; blue were for SNP-based GWAS, while green were for those done using indels. It was evident that most of the cloned/characterized genes for grain size and shape were in collinearity between indica and japonica.

