Fig. 1.

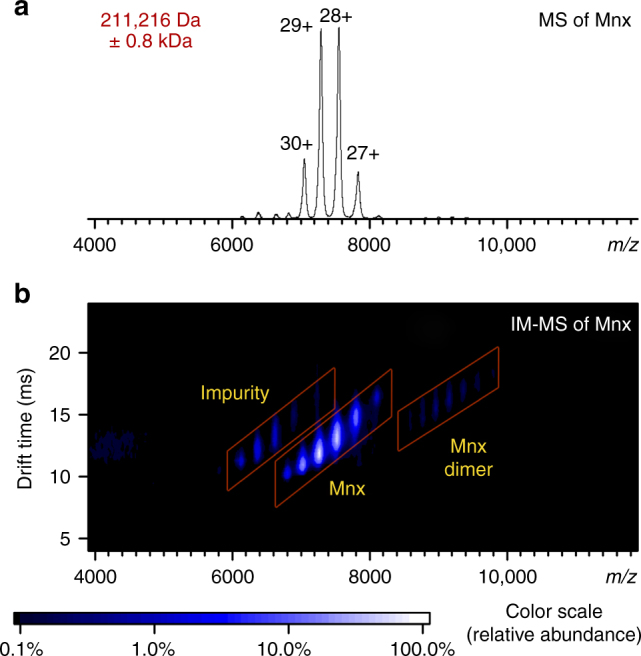
Native MS of Mnx complex. a Mass spectrum and b ion mobility–mass spectrum of the intact Mnx complex. The major species correspond to the Mnx complex with a molecular weight of 211 kDa. The impurity is a host cell protein complex that carried over during purification (Supplementary Note 2). Identical data are displayed in a, b, with b showing the extra dimension of separation in the vertical axis from the drift time recorded in ion mobility. The IM–MS spectrum has the m/z on the horizontal axis from the mass spectrometry measurement and the drift time measurement from the ion mobility separation in the vertical axis. The ions were separated based on their shape-to-charge ratio in ion mobility and arrived at the mass analyzer for m/z detection at discrete drift times, generating the two-dimensional spectra. The color of the spots indicates the relative abundance as shown by the scale at the bottom. The full peak width at half maximum in a is about 55 m/z, or about 1.6 kDa (±0.8 kDa) in uncertainty in mass determination
