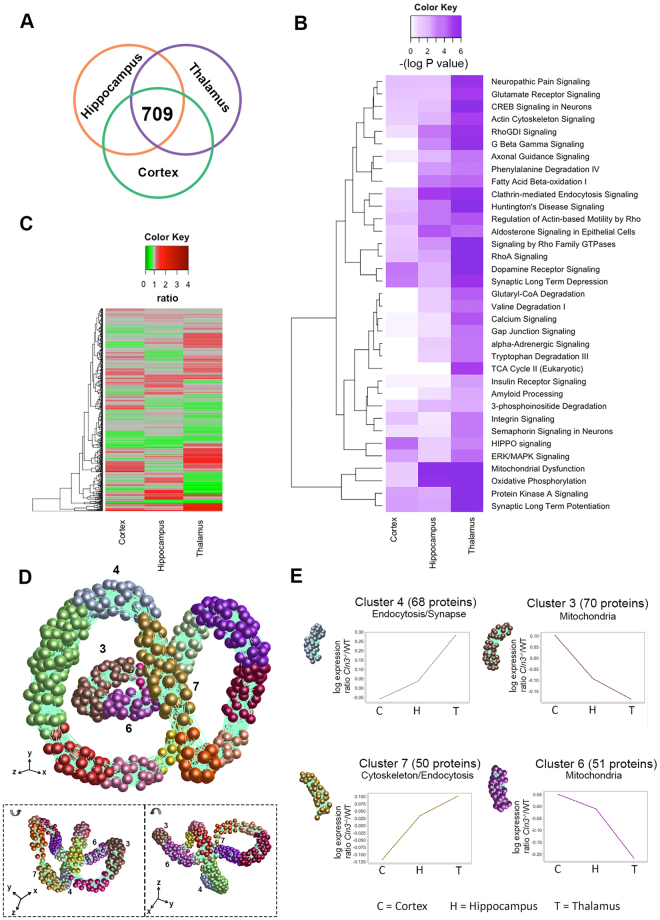
Figure 3.
Differentially vulnerable synaptic population molecular profiling. (a) Venn diagram and heat map show the 709 common proteins identified and overlapped in cortical, hippocampus and thalamic synaptic proteomic datasets. (B) Heat map representing the significance (−log P value) of the canonical pathways identified in IPA across cortex, hippocampus and thalamus datasets. It is observed a preogressive increase in significance correlating to the synaptic vulnerability pattern described previously. (C) Heat map showing the 709 common proteins identified and overlapping in cortical, hippocampus and thalamic synaptic proteomic datasets. (D) BioLayout clustering 3D representation of proteomic expression data across differentially vulnerable synaptic populations orientated at 3 different angles. Each sphere represents a single protein and the edge represents how similar their expression trend is towards the other proteins in the dataset. The closer the spheres are the more similar expression trend they have. The colours represent the different clusters of co-expressed proteins. (E) Expression profile means in log scale (Cln3 −/− /WT) of co-expressed proteins in clusters 3, 4, 6 and 7 (Supplementary Tables S1) and its main biological function/subcellular compartment identified by DAVID enrichment analysis (See Supplementary Table S2). Clusters highlighted show steady up or downregulation across cortex (C), hippocampus (H) and thalamic (T) regions correlating with the vulnerability status of synapses.

