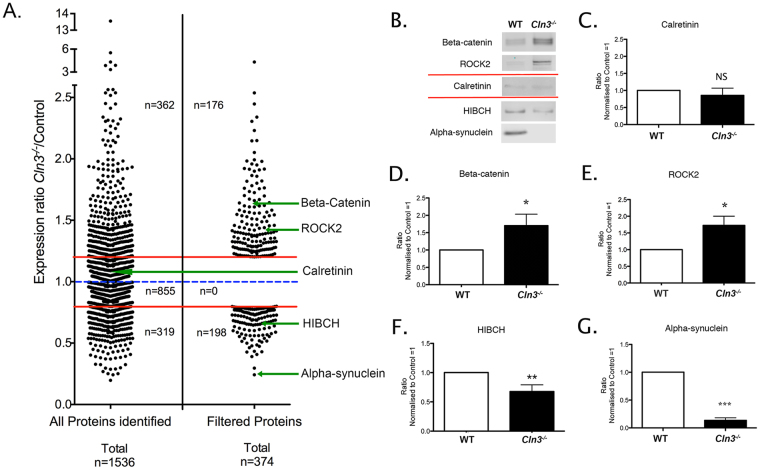
Figure 4.
Synaptic thalamic proteome filtering and validation. (A) Dot plot demonstrating the process of proteomic data filtering. Each data point represents an individual protein identified using iTRAQ proteomic technique. LHS 1536 proteins were identified across all thalamic samples. Following filtering (see Methods) a molecular fingerprint for thalamic synaptic alterations comprising 374 candidate proteins was produced (RHS; see also Supplementary Tables S3 and S4). (B) QWB representative bands for two upregulated (β-catenin and ROCK2), two downregulated (HIBCH and α-synuclein) and one unchanged protein candidate (calretinin) verifying the proteomic data. (C and G). Quantification and statistical QWB analysis showing the magnitude of alteration in Cln3 −/− thalamic synaptic fractions. All the selected candidate proteins were altered as indicated by this iTRAQ analysis. Mean ± SEM; *P < 0.05; ***P < 0.001 (Student T test, n = 6 mice per each genotype).

