Figure 5.
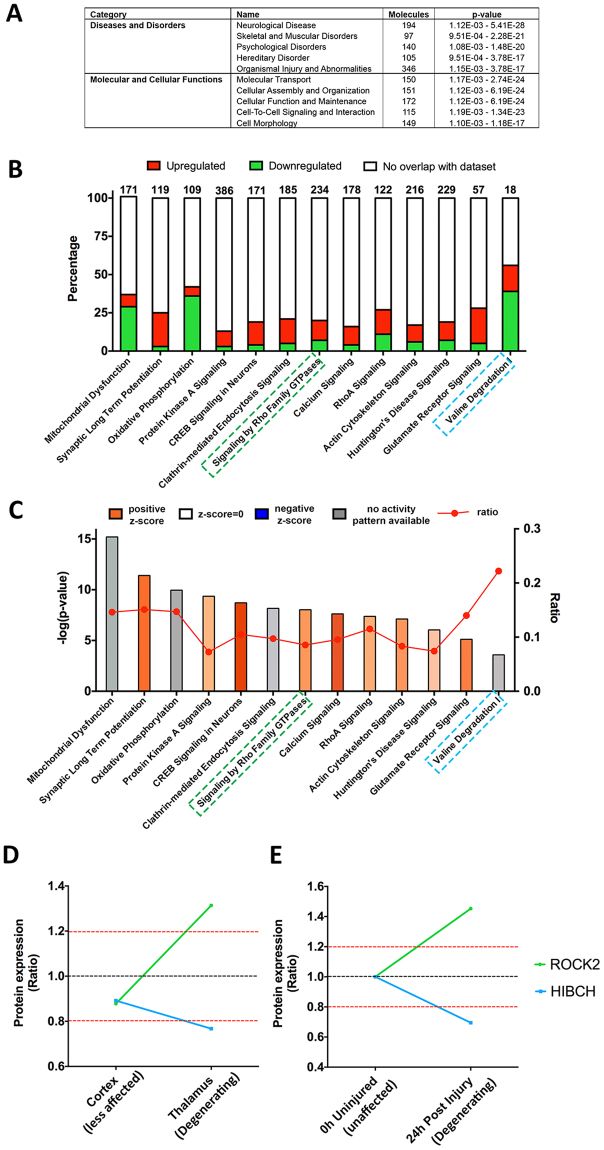
IPA analysis of the thalamic synaptic proteome. (A) Table of top 5 “diseases and disorders” and “molecular and cellular functions”. (B and C) Canonical pathways bar chart of representative pathways showing, (B) The percentage of upregulated and downregulated proteins within each pathway. Numbers on the top indicate the total number of proteins within the canonical pathway. (C) Significance of the association between the dataset and the canonical pathway (−log(p-value) and ratio) and z-score prediction of activation/inhibition (see Methods). Pathways highlighted in green and blue are associated to ROCK2 and HIBCH, respectively. (D) HIBCH and ROCK2 protein expression ratio across cortex (“less affected’) and thalamic (“degenerating”) synapses in these moderately affected Cln3 −/− mice (Cln3 −/−/WT). (E) HIBCH and ROCK2 protein expression is conserved in models of injury, following similar pattern of expression 24 hours post-injury when synapses start to degenerate2.

