Figure 6.
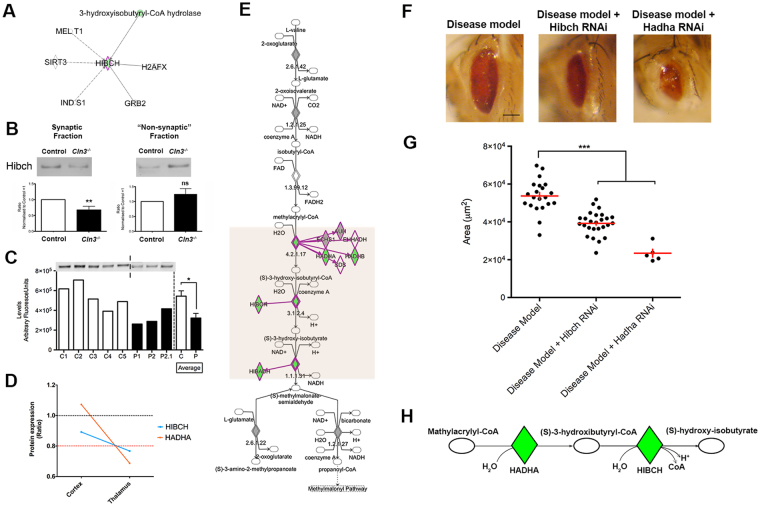
CLN3 induced degeneration is enhanced by the genetic downregulation of HIBCH and HADHA in vivo impacting in valine catabolism pathway. (A) HIBCH proteome interactome represented by IPA indicating only 6 gene/proteins are known to interact with HIBCH. (B) QWB bands and quantification of HIBCH in synaptic and “non synaptic” fractions of Cln3 −/− and control mice in thalamic protein extracts showing a downregulation in synapses and upregulation in non-synaptic parts **P < 0.01, ns P > 0.05 (Student T test). (C) QWB bands and quantification of cortical “crude” synaptosomes isolated from post mortem human JNCL patients (P) and controls (C) showing its downregulation at end stages in human disease *P<0.05 (Student T test). (D) HIBCH and HADHA are co-expressed and their expression trend correlates to the vulnerability status of synapses: unchanged in cortex (“spared”) and downregulated in thalamus (“degenerating”). (E) Valine degradation pathway represented with IPA. The first protein which expression is perturbed in the degradation process of valine is HADHA; upstream of HIBCH. (F–G) Representative light microscope images of Drosophila eyes of disease model (DM), DM + HIBCH RNAi and DM + HADHA RNAi and corresponding quantification of the eye surface area. Scale bar = 100um. ***P < 0.001 (One-way ANOVA and Tukey’s multiple comparison test as a post-hoc). (H) Schematic representation of the fourth and fifth steps of the valine catabolism cascade showing the enzymes HADHA and HIBCH catalyzing each step respectively. (A,E & H) Colored nodes illustrate proteins present in the thalamic dataset in Cln3 −/− with respect WT. Nodes in grey represent proteins changed <20%, down-/up-regulated proteins by >20% are represented in green and red respectively. Orange box highlights the steps that are disrupted in the valine degradation cascade. Dotted lines on representative westerns indicate cropping of bands from the same membrane.

