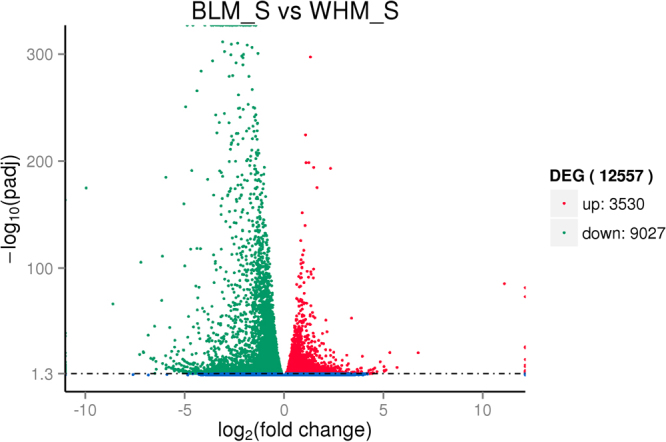
Figure 5.

Comparison of expression patterns of differential unigenes identified between two mink skins with black and white coat colour. The X axis indicates gene expression changes in different samples, and the Y axis indicates the significant degree of gene expression changes. Scattered points represent each gene, the red dots represent differentially up-regulated genes, the green dots represent differentially down-regulated genes, and the blue dots represent no significant difference gene. In total, 12,557 unigenes were identified as differentially expressed between skins with two coat colours, including 3,530 genes that were up-regulated and 9,027 down-regulated genes.
