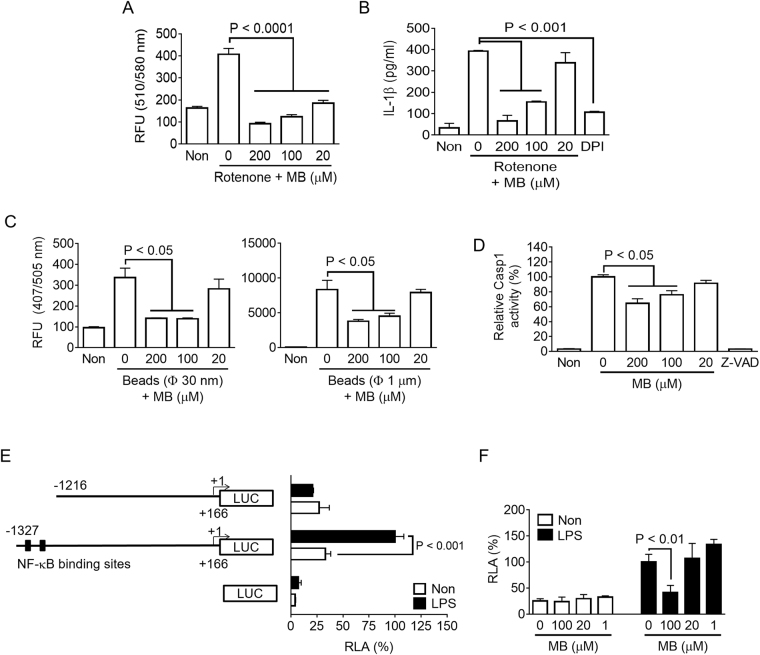
Figure 3.
Effect of MB on mitochondrial ROS production, phagocytosis, caspase-1 activity, and NLRP3 promoter activity. (A) BMDMs were treated with rotenone (160 μM) and the indicated dosages of MB for 6 h, after which mitochondrial ROS generation was analyzed. (B) LPS-primed BMDMs were treated with rotenone with/without MB, and secretion of IL-1β was measured by ELISA. (C) BMDMs were incubated with two different diameters (30 nm or 1 μm) of fluorescent beads for 6 h, followed by measurement of intracellular beads based on florescence intensity. (D) Recombinant human caspase-1 (rhCasp1) was incubated with its substrate (YVAD-pNA) in the presence of MB as indicated. (E) Luciferase-expressing plasmids (pGL3) controlled by mouse NLRP3 promoters (−1,327 nt to + 166 nt or −1,216 nt to + 166 nt) were transfected into RAW 264.7 cells, which were treated with/without LPS. Left schematic figures indicate the mouse NLRP3 promoter regions (filled boxes, NF-κB binding sites; LUC, luciferase gene). (F) RAW 264.7 cells were transfected with pGL3 (−1,327 nt to + 166 nt) and treated with MB and/or LPS. Relative luciferase activity (RLA) was analyzed. Bar graph presents the mean ± SD.

