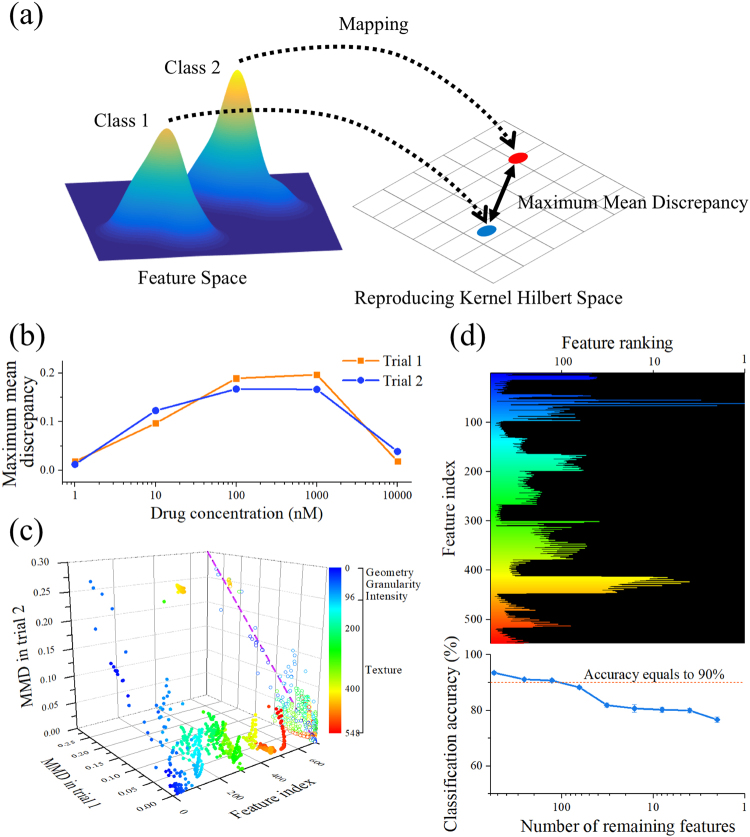
Figure 4.
Calculating maximum mean discrepancy (MMD) between the negative control and drug-treated cell population. (a) Illustration of the maximum mean discrepancy (MMD). (b) MMD between the negative control and drug-treated cell population at each drug concentration. Trial 1: data from the first experiment. Trial 2: data from the second experiment. (c) MMD of each feature in trial 1 at 1 µM and trial 2 at 100 nM. At these concentrations, the MMD in the whole feature space is the largest in each experiment. Features with a higher score of the MMD in both trials are highly correlated, indicating that the significant features were consistent in both experiments. The color scale represents feature index, showing types of morphological changes that undergo larger scores of the MMD. (d) Classification accuracy with a reduced number of features. Lower MMD features were removed based on the ranking of the MMD for each feature in the classification between the negative control and the dataset at 1 µM in the first experiment (top). The classification accuracy was maintained over 90% with more than 100 features (bottom). The color scale is consistent with that in Fig. 4c. Feature ranking and the number of remaining features are illustrated in logarithmic scale. The error bars represent standard errors of the cross-validation estimation of average classification accuracy (n = 10).

