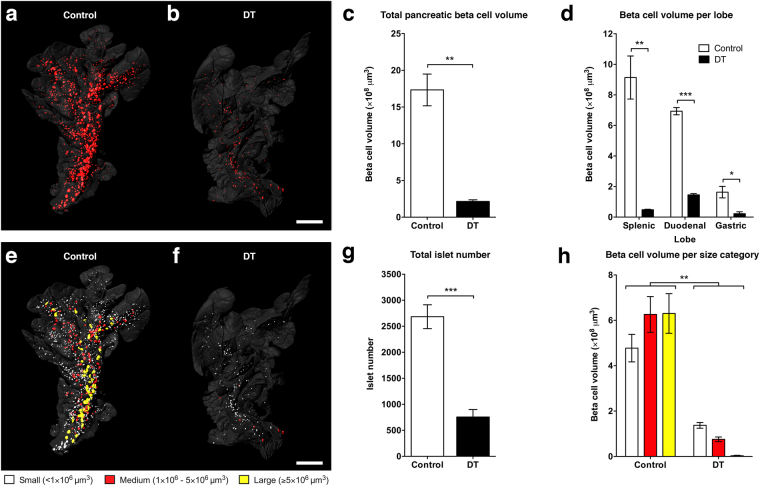
Figure 1.
Optical projection tomography shows pancreatic beta cell loss in the RIP-DTR mouse. (a,b) Isosurface rendered OPT images of representative splenic lobes of the RIP-DTR mouse at 15 days after sham (a) or diphtheria toxin (b) treatment. Three-dimensional surface renderings are based on anti-insulin staining (red) and intrinsic autofluorescence portraying the anatomy (grey). (c) Graph of the average total pancreatic beta cell volume illustrating severe beta cell loss after diphtheria toxin treatment. (d) Graph showing that beta cell loss in the RIP-DTR pancreas is seen in all three lobes. (e,f) OPT images displaying pseudo-colours yellow (>5 × 106 μm3), red (1–5 × 106 μm3), and white (<1 × 106 μm3) to indicate islets of different sizes in the splenic lobe of control (e) and RIP-DTR (f) pancreas. (g) Graph depicting the overall number of islets in the pancreas of sham or diphtheria toxin treated mice. (h) Graph showing the average cumulative beta cell volume of all islets within their respective size categories. Data presented as mean ± SE with n = 4 animals per group. Statistical significance indicated as *P < 0.05, **P < 0.01, ***P < 0.001. Scale bars = 2 mm.

