Figure 2.
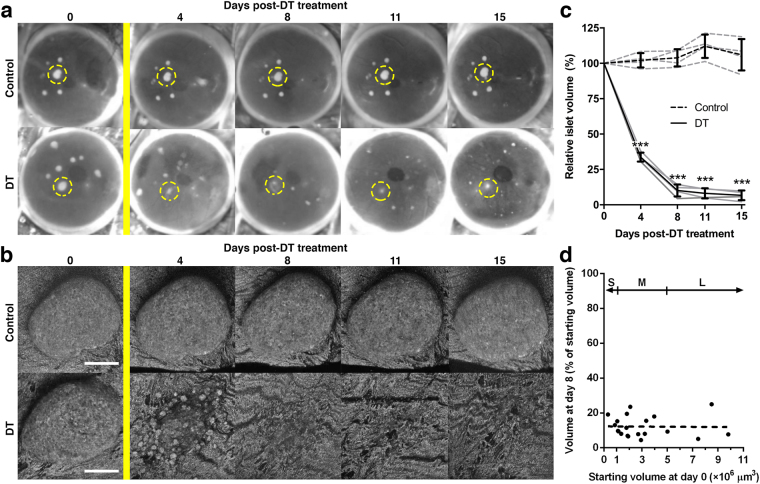
Repeated in vivo confocal imaging details the destruction of RIP-DTR islets over time. (a,b) Consecutively collected photographs (a) and confocal images (b) of engrafted RIP-DTR positive and negative islets in the eye of a diphtheria toxin-resistant control mouse. Yellow bar indicates diphtheria toxin treatment, dashed yellow circles in (a) show examples of individual islets followed over time in (b) using backscattered light to monitor morphological changes. (c) Graph showing the relative islet volume of RIP-DTR positive and negative islets in the anterior chamber of the eye over time following DT treatment. Islet volumes are shown averaged per mouse (grey lines, n = 4–11 islets per eye) and averaged per animal (black lines, n = 4 mice). (d) Relative decrease in islet volume (day 8) of individual RIP-DTR positive islets plotted against their initial starting volume (day 0). Linear regression analysis shows that no size-dependent sensitivity to DT-treatment exists (R2 < 0.001, n = 20 islets). Islet size categories as defined for OPT data analysis (“S” = small, “M” = medium, “L” = large, see Fig. 1) are displayed for comparison purposes. Data presented as mean ± SD. Statistical significance indicated as ***P < 0.001. Confocal images are shown as maximum intensity projections. Scale bars = 50 μm.

