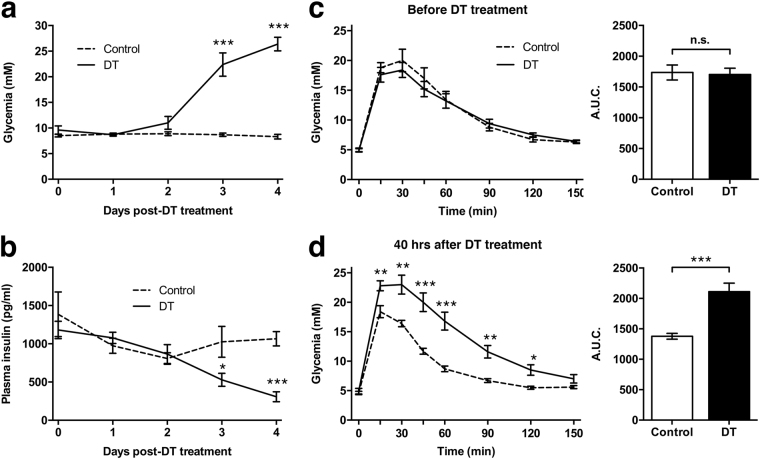
Figure 3.
Metabolic features of the RIP-DTR mouse. (a,b) Unfasted blood glucose levels (a) and 4 hours fasted plasma insulin levels (b) measured daily following diphtheria toxin (solid line) or sham treatment (dashed line) of RIP-DTR mice. Control, n = 10 and DT, n = 5. (c,d) Graphs of glucose tolerance tests performed one week before and 40 hours after DT treatment of RIP-DTR positive and negative mice of mixed genders. Area under the curve (A.U.C.) was calculated, showing a significant difference 40 hours after treatment. Control, n = 9 and DT, n = 13. Data presented as mean ± SE. Statistical significance indicated as *P < 0.05, **P < 0.01, ***P < 0.001. n.s.: nonsignificant.

