Figure 5.
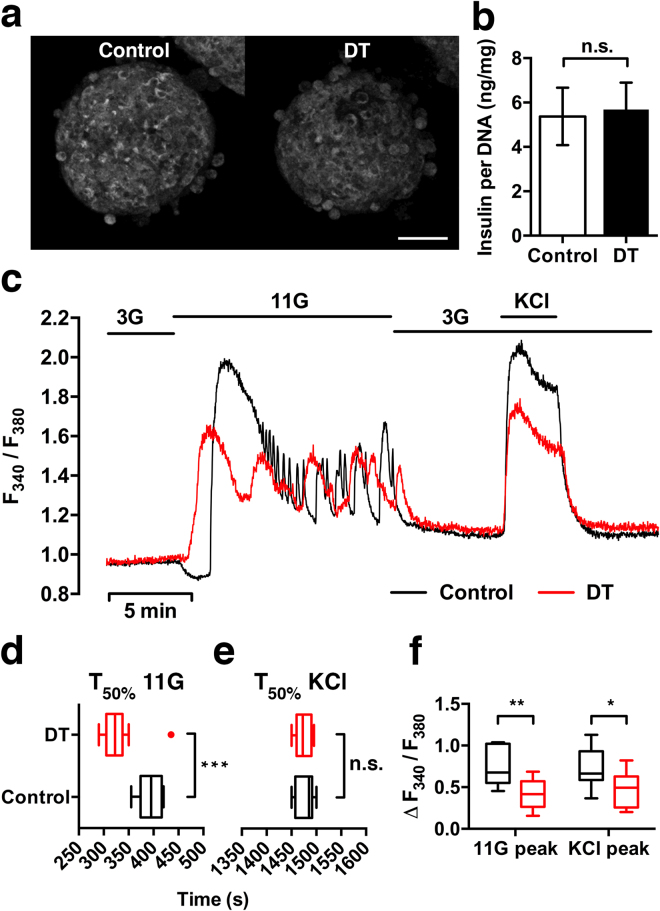
Insulin content and intracellular Ca2+ signalling of RIP-DTR islets one day after diphtheria toxin treatment. (a) Representative confocal images of isolated islets one day after DT or sham treatment of RIP-DTR mice. Reflected light signal shows that DT-treated islets have preserved insulin granule scattering properties and similar morphology compared to controls. (b) Quantification of whole islet insulin content analysed by ELISA and corrected for total DNA content (mean ± SE, n = 8–9 samples per condition). (c) Representative traces from [Ca2+]i measurements of islets loaded with Fura-2 AM and perfused for 2,000 s with 3 or 11 mM glucose and 25 mM KCl. (d–f) Analysis of the [Ca2+]i traces (n = 10–12 islets per condition) for response time to the stimulus (time to reach 50% of the peak) and relative increase of fluorescence (peak height). Whiskers represent tukey (d) or min/max values (e,f). Islets originated from 3 mice per condition. Statistical significance indicated as *P < 0.05, **P < 0.01, ***P < 0.001, n.s.: nonsignificant. Confocal images are shown as maximum intensity projections. Scale bar = 50 µm.

