Fig. 1.
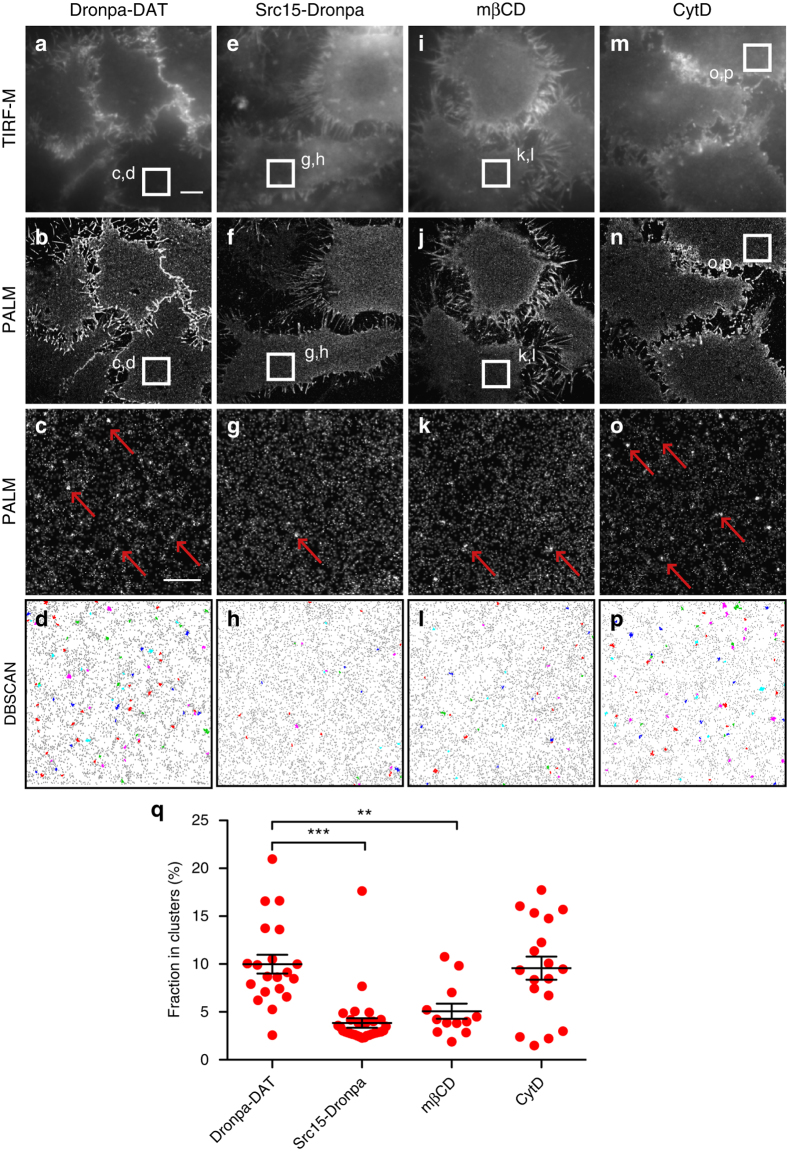
Dronpa-DAT distributes to cholesterol-dependent nanodomains in the plasma membrane of living CAD cells. a–d Images of untreated live CAD cells transiently expressing Dronpa-DAT. a TIRF-M image. b Reconstructed PALM image. c Enlarged PALM image corresponding to the boxed region in a, b. d DBSCAN-based cluster map of Dronpa-DAT distribution. Clustered localizations are shown by color-coding with non-clustered localizations in gray. e–h Images of live CAD cells expressing the myristoylated N-terminus of p60SRC fused to Dronpa (Src15-Dronpa). e TIRF-M image, f reconstructed PALM image. g Enlarged PALM image corresponding to the boxed region in e, f. h DBSCAN-based cluster map of Src15-Dronpa distribution. Clustered localizations are shown by color-coding with non-clustered localizations in gray. i–l Images of Dronpa-DAT expressing CAD cells treated with 5 mM methyl-β-cyclodextrin (mβCD) to remove cholesterol. i TIRF-M image, j reconstructed PALM image. k Enlarged PALM image corresponding to the boxed region in i, j. i DBSCAN-based cluster map of Dronpa-DAT distribution. m–p Images of Dronpa-DAT expressing CAD cells treated with 5 μg ml−1 cytochalasin D (CytD) to disrupt the actin skeleton. m TIRF-M image, n reconstructed PALM image. o Enlarged PALM image corresponding to the boxed region in m, n. p DBSCAN-based cluster map of Dronpa-DAT distribution. q Clustering of Dronpa-DAT measured as the fraction in % of total localizations (means ± s.e.m., *p < 0.05, one-way ANOVA with a Bonferroni’s post-test). Data are based on 12–20 cells from three independent experiments. Red arrows mark examples of DAT clustered in nanodomains. Scale bars a, b, e, f, i, j, m, n 5 μm, c, d, g, h, k, l, o, p 1 μm

