
Fig. 7.
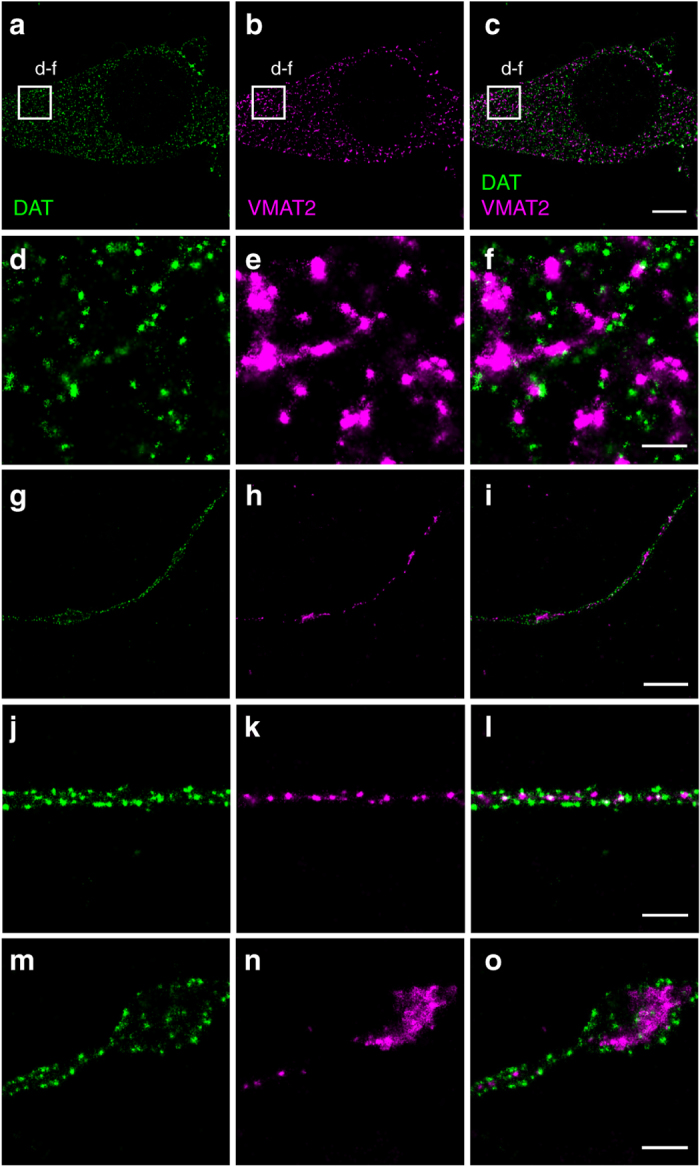
Cross-section through the cell body, extensions and varicosities of dopaminergic neurons showing by dual-color dSTORM imaging the distinct distribution of the vesicular monoamine transporter-2 (VMAT2) compared to DAT. DAT was visualized by immunolabeling and Alexa647-conjugated secondary antibody. VMAT2 was visualized by immunolabeling and CF568-conjugated secondary antibody. a Somatic distribution of DAT. b Somatic distribution of VMAT2. c Merged image of a and b. d–f Enlarged STORM images corresponding to the boxes shown in a–c. g Distribution of DAT in extension with varicosities. h Distribution of VMAT2 in extension with varicosities. i Merged image of g and h. j Distribution of DAT in extension. k Distribution of VMAT2 in extension. l Merged image of j and k. m Distribution of DAT in varicosity. n Distribution of VMAT2 in varicosity. o Merge image of m and n. Scale bars a–c 5 μm, g–i 2 μm, d–f, j–o 500 nm