Figure 3.
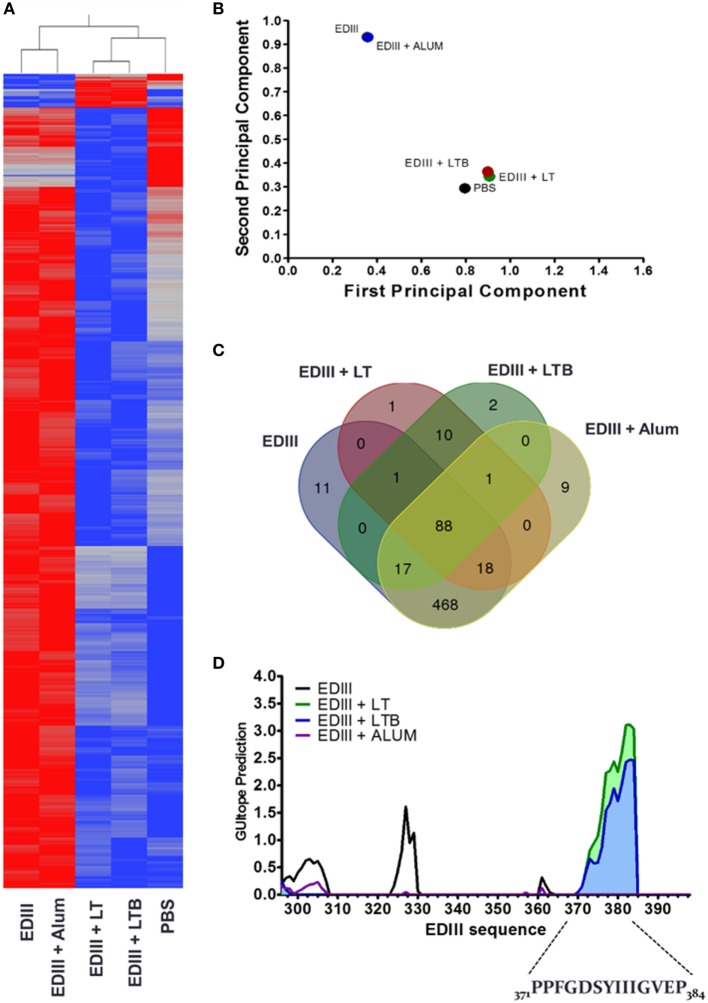
Immunosignature analyses of purified envelope glycoprotein domain III (EDIII)-specific IgG antibodies. (A) Heat map demonstrating the immunosignatures detected with EDIII-specific IgG antibodies purified from serum samples collected from mice submitted to the different immunization regimens and a mock mouse group (control). A Student’s t-test (p < 3.33 × 10⁻⁶) between vaccine groups was used to select the informative peptides. Hierarchical clustering using EUCLIDEAN distance was used as a measure of similarity to cluster the selected peptides (x axis) and vaccine groups (y axis). Peptides’ intensity is colored where blue corresponding to low intensity and red to high intensity. (B) Variance of immune responses among different vaccine groups. Variation among vaccine groups [pooled sera per group (n = 5)] for all significant peptides sequences in the principal component analysis plot, where the first two principal components are plotted and individuals are colored according to the vaccination groups. (C) Venn diagram between vaccine groups. Results summarize the overlapping peptides that are significantly different above 1.3-fold change of the mock group versus each vaccine group. (D) Antigenic epitope prediction for vaccine groups using random peptide arrays. Significant peptides sequences recognized by antibodies of each vaccine group were submitted to epitope prediction with the GuiTope software and using the EDIII protein sequence from DENV2 New Guinea C (AHG97599.1) as reference. Each line graph represents the GuiTope prediction score for each vaccine group.

