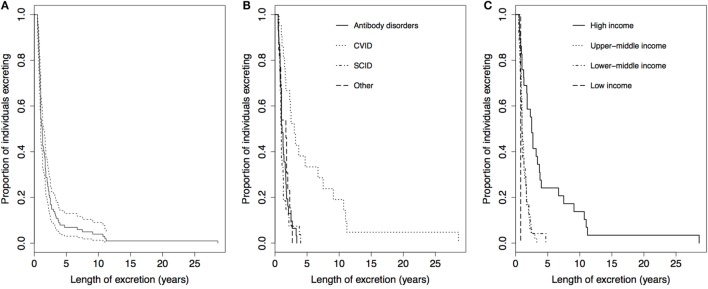
Figure 3.
Kaplan–Meier curves for the length of poliovirus excretion in reported chronic and prolonged immunodeficiency-related vaccine-derived poliovirus cases, 1962–2016. (A) For all reported cases (n = 101, dotted lines: 95% Confidence Limits). (B) Comparison by income classification of country of residence: low income (n = 1), lower-middle income (n = 24), upper-middle income (n = 47), and high-income (n = 29). Two-tailed P < 0.001 for log-rank test for equality of Kaplan–Meier curves. (C) Comparison by primary immunodeficiency disorder: antibody disorders (n = 31), CVID (n = 21), SCID and other combined humoral T-cell deficiencies (n = 27), and other disorders (n = 13). Two-tailed P < 0.001 for log-rank test for equality of Kaplan–Meier curves. Abbreviation: CVID, common variable immunodeficiency disorder; SCID, severe combined immunodeficiency disorder.

