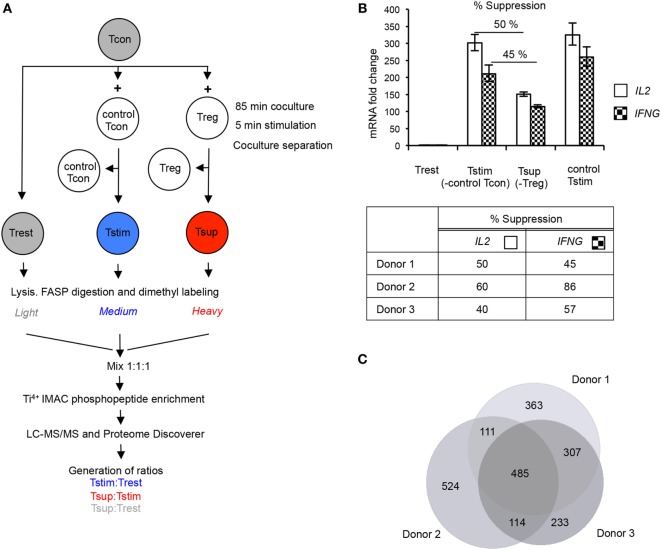
Figure 1.
Experimental setup and quality controls for phosphoproteomics in primary human T cells. (A) Conventional CD4+CD25– T cells (Tcons) were cocultured either with allogeneic Tcons or regulatory T cells (Tregs), and cocultures were stimulated for 5 min with cross-linked anti-CD3/anti-CD28 antibodies. Stimulation was stopped on ice. Tstim (blue) and Tsup (red) were obtained after separation of T cell receptor (TCR)-stimulated Tcon:Tcon or Tcon:Treg cocultures, respectively. Unstimulated Tcons (Trest; gray) from the same donor were processed in parallel. Proteins were digested, peptides dimethyl-labeled and mixed, before phosphopeptides were enriched and measured by mass spectrometry (MS). Relative abundance of phosphopeptides was quantified by calculating the intensity ratios between the different samples as indicated. (B) An aliquot of cells used for phosphoproteomics was stimulated for 3 h before coculture separation, and suppression of cytokine mRNA was measured in re-isolated responder Tcons [Trest, Tstim, and Tsup as in panel (A)]. As additional control, responder Tcons were stimulated without allogeneic Tcons (control Tstim). IL2 and IFNG mRNA were measured by quantitative RT-PCR, normalized to GAPDH mRNA. Results are presented as fold change compared to Trest (set to 1). The upper panel shows a representative donor (mean ± SD of technical PCR duplicates). Percentage suppression of respective cytokines in Tsup as compared to Tstim was calculated and is summarized for the three phosphoproteomics donors (lower panel). T cells were processed in three independent experiments (one experiment/donor) and phosphopeptide enrichment was performed in two independent experiments. (C) The number of unique phosphopeptides detected in each donor was determined, and the overlap is depicted as Venn diagram.

