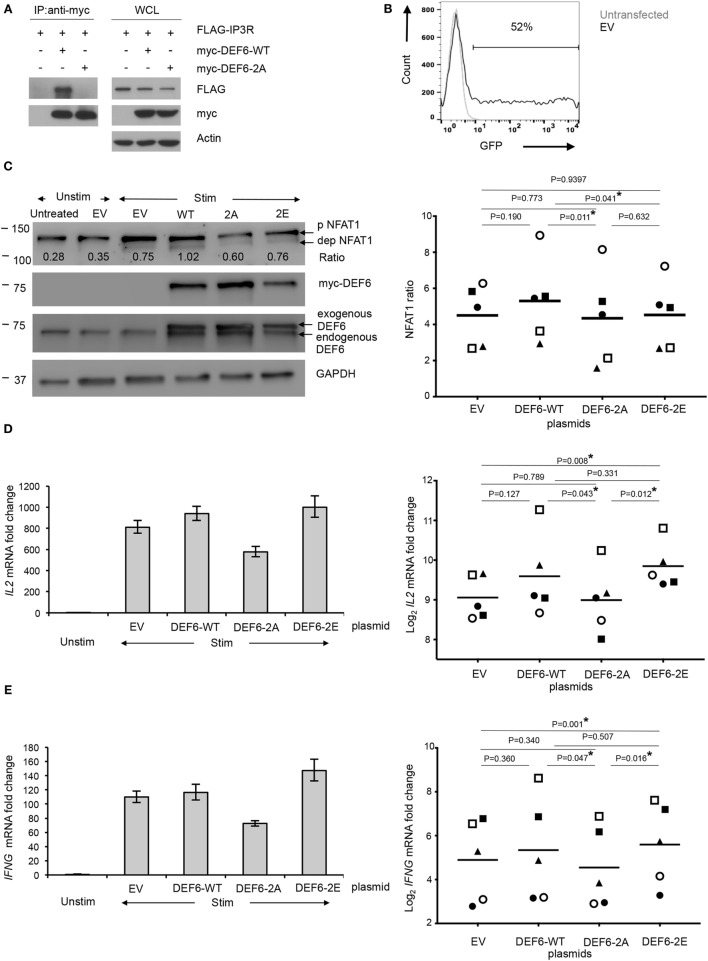
Figure 5.
T595 and S597 phosphosites in DEF6 protein contribute to IP3R interaction and T cell activation. Plasmids encoding for DEF6-WT, DEF6 T595_S597 phospho-mutant (DEF6-2A), and DEF6 T595_S597 phospho-mimic (DEF6-2E) were generated. (A) HEK293 cells were cotransfected with indicated myc-tagged DEF6 constructs along with FLAG-tagged IP3R. Whole cell lysates (WCLs) were subjected to immunoprecipitation (IP) with anti-myc antibody (left), and aliquots of WCLs were kept untreated (right). Western blot antibodies are indicated. A representative experiment of 2 is shown. (B–E) Primary human Tcons were transiently transfected with plasmids encoding the indicated DEF6 protein or empty vector [EV; green fluorescent protein (GFP) in place of DEF6] for 8 h. Where indicated, cells were subsequently stimulated (Stim) with anti-CD3/anti-CD28 antibodies and processed as follows: (B) transfection efficiency based on GFP expression in EV-transfected cells was determined by flow cytometry. It was pre-gated on live lymphocytes based on fsc/ssc. Overlaid histogram of GFP expression in untransfected and EV-transfected Tcons is representative of five donors in two independent experiments. (C) Cells were stimulated for 5 min and analyzed by Western blot with antibodies against indicated targets (left). The ratio of levels of dephosphorylated NFAT1 and phosphorylated NFAT1 was calculated after quantification of the bands. Expression levels of myc-tagged DEF6 or total DEF6 and GAPDH served as transfection and loading controls, respectively. Blot is representative of five donors. Right: NFAT1 ratios were normalized to the corresponding NFAT1 ratio in unstimulated Tcons of the same donor which was set to 1. Individual NFAT1 ratios from n = 5 donors (represented by individual symbol per donor) from 2 independent experiments along with the mean values (line) are shown. IL2 (D) and IFNG (E) mRNA in transfected Tcons after 3 h of stimulation or without stimulation (Unstim), normalized to RPL13A mRNA. Results are presented as fold change compared to unstimulated Tcons of the same donor, which was set to 1. Left: mean ± SD of technical triplicates from quantitative RT-PCR is shown for one donor, representative of five donors from two independent experiments. Right: individual values of log2 fold change of mRNA levels of the respective cytokines from five donors (represented by individual symbol) are shown along with mean values (lines). P values (C–E) were determined by paired, two-sided Student’s t-test (*P < 0.05).

