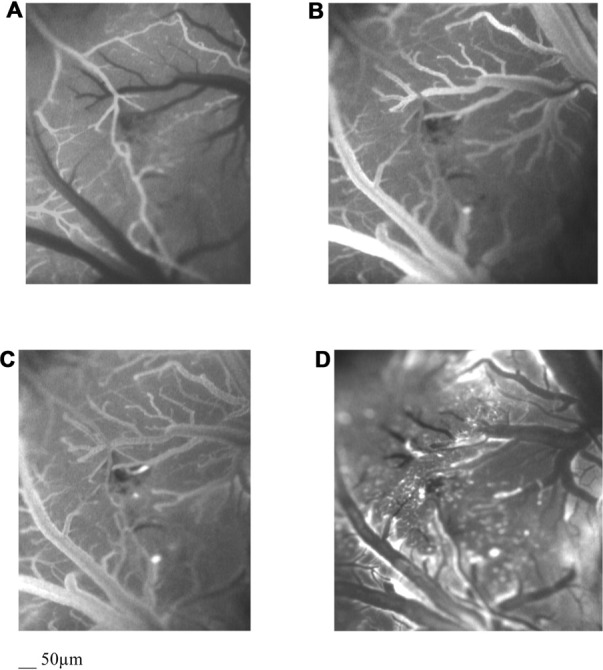
Figure 2.

Computer-assisted images by fluorescent microscopy of the arteriolar (A) and the venular (B) pial network under baseline conditions, at the end of BCCAO (C) and at the end of reperfusion (D) in a hypoperfused rat. The increase in microvascular leakage is outlined by the marked change in the color of interstitium (from black to white).
